As analytics get more and more advanced, and new sites pop up, there are more metrics than ever to measure how a player played in any given game, to the point where it makes it too confusing. We always have points and rebounds and assists, but then you have +/- (which is really poor on a single game basis), and ORtg, and DRtg and usage. It truly makes it difficult to come to a consensus.
One of the things I try to do in my IRL job is to standardize the thing we are measuring. As in, being able to use a single data point and then compare it to the same metric over a lot of data points helps put the data in context. That way any shortcomings of any given stat are at least consistent across multiple games and months and seasons, then there is value, even with caveats.
With all that said, I’ve been obsessed with Hoop-Explorer for a while now (and reference it in almost all my posts) and have fallen in love with their Player Impact score system that they publish for every team after every game. If I were to describe what it does, it basically creates a single game RAPM that allows us to not only take the box score into account, but also stats like on/off as well as teammates on the floor and lineups from the other team. It puts a number that is easily comparable across components of a game that are not easily visible and don’t show up in any box score.
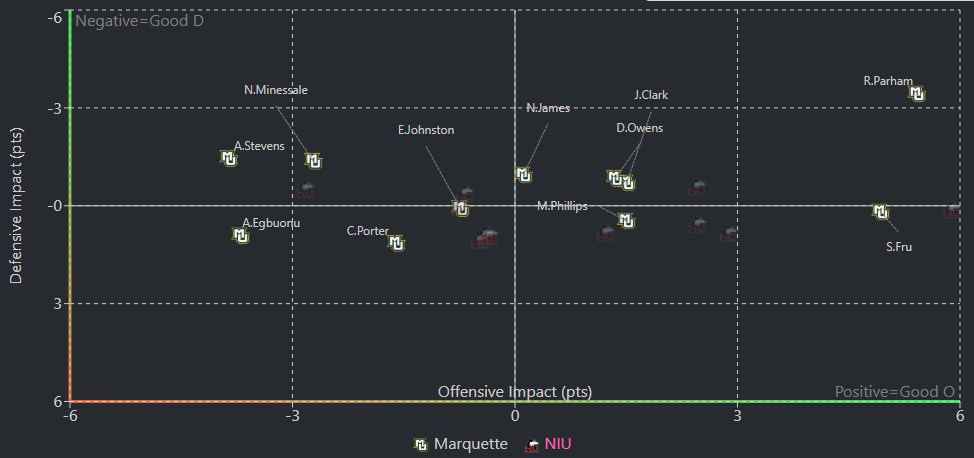
The chart published per game in particular is visually striking, and allows you to quickly compare all the players on both teams in a way that also gives you details about which parts of the game each player had the most impact on. In this example, Royce was the best offensive (furthest right) and defensive player (highest up).
But again, the best part about this stat is we have multiple years worth of data to use as a reference point.
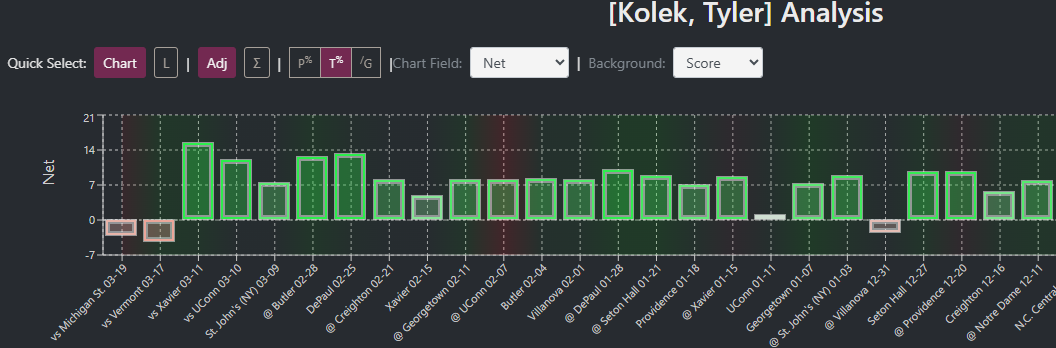
Here’s what Tyler Kolek did to win Big East Player of the Year in 2023, before getting injured in the NCAA Tournament.
One thing I’ve heard is that Hoop-Explorer can be a bit intimidating, and it’s not always intuitive which pages you need to go to, or filters to select. So what I’ve done the last few years is create a Marquette specific dashboard that gives you everything you’d like to see right up front.
https://datastudio.google.com/reporting/0d50316d-bc8e-424d-8dfe-1fcb99cf72ce
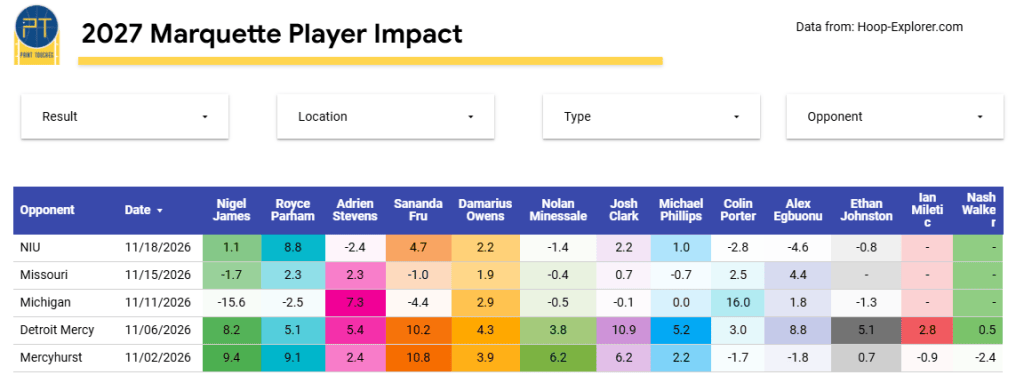
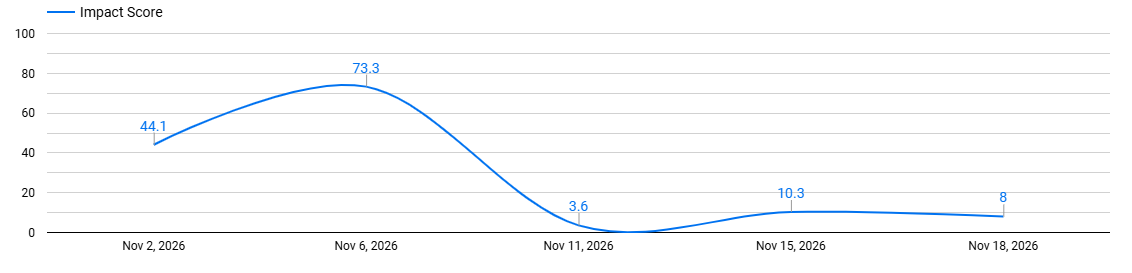
I have to update it manually, so usually takes me 12 to 24 hours after a game to input the data, but once it’s in there, you have a few ways to see the data. You have all players by game as seen above.
You have season totals and averages.
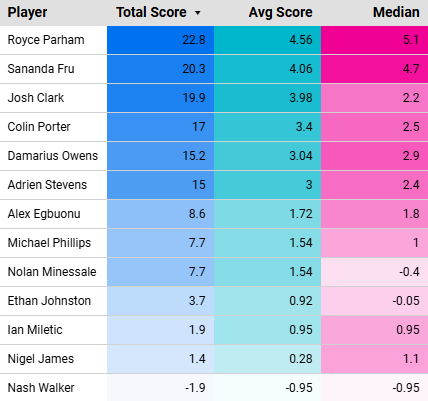
And you have filters to be able to see certain games, opponents or locations.
One last thing, player impact adjusts for opponent quality, so that makes full game measures easily comparable. This formula graded out Marquette as playing better against Missouri in a loss than against Northern Illinois in a win.
So feel free to give it a spin and let me know what you think. I’ll drop the link to previous versions as well, should you want to go back in time at any point.
Make a one-time donation
Choose an amount
Or enter a custom amount
Your contribution is appreciated.


Leave a Reply