I’m a bit of a nerd about trying to assess the validity of predicted outcomes. It’s a big part of my IRL job. I’m also a whole nerd about college basketball, hence the last 11 years of all this.
So I usually spend the month of October collecting drops of upcoming season projections by reputable national media figures and credible computer models to use as a baseline the rest of the season. But KenPom day stands out on its own, as it is by far the most prominent and most cited rankings system in the college basketball universe.
Which is why I did a double take when I saw this from a great journalist that covers Providence as well as any beat guy in any program around the Big East.
Without delving into all of the reasons why this is a steaming dump of a take from a process point of view, it did pique some curiosity as to how the preseason projections had held up over a longer period of time than one season, for a sample like the Big East.
And then I came across this gorgeous visualization of that exact thing, only from an A10 point of view, from @A10Stats, a fantastic account I had to follow even if I have zero interest in anything about the league.
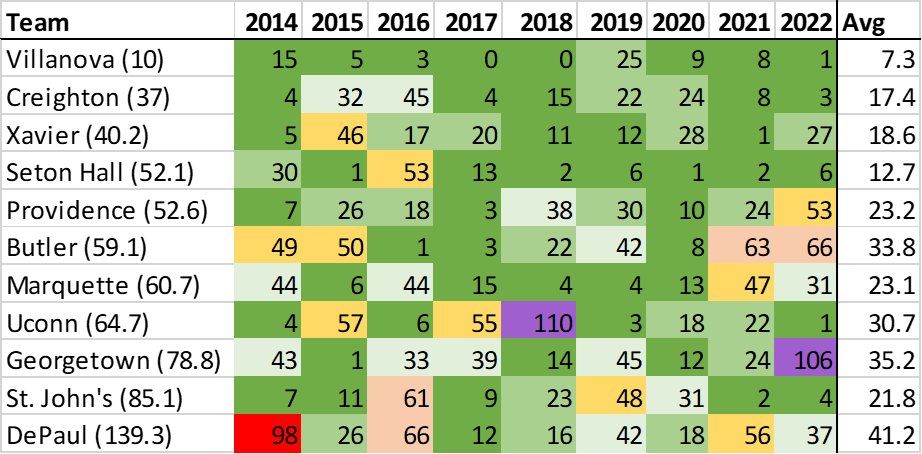
I wasn’t able to replicate it perfectly, but in one image, this is a pretty good big picture view of which teams KenPom has been most accurate on from preseason to final results, sorted by average final ranking since 2014.
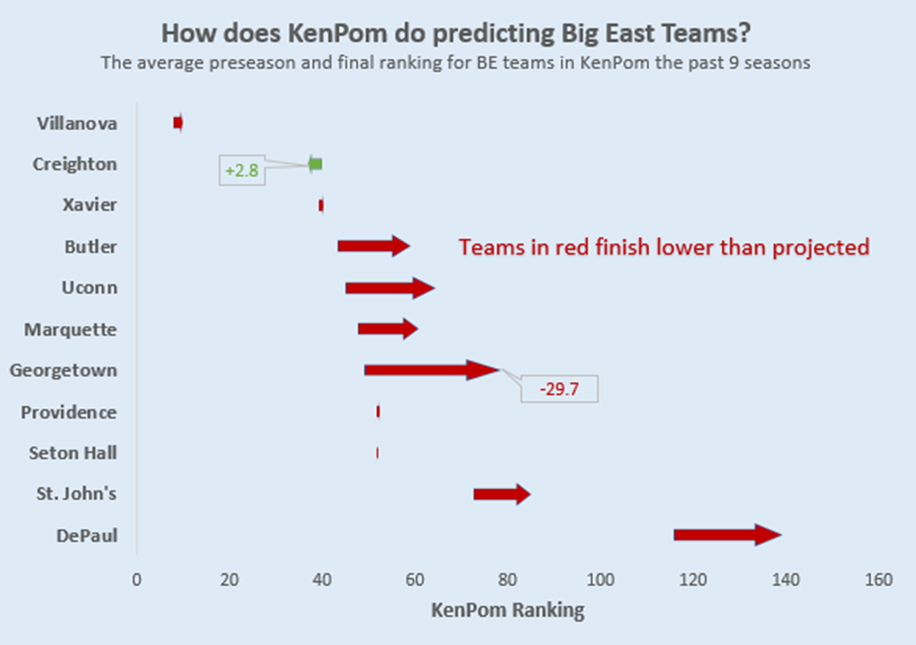
As it turns out, since the reformation, KenPom’s preseason rankings have consistently overvalued most Big East teams. Only Creighton has averaged a higher finish than its preseason projection, and even that was only by 2.8 spots. The average Big East team finished 17 spots below where they were pegged before the season started.
Of course, the average only tells you so much. If I’m too high on a team by 50 spots one year and low on them by 50 the next, on average I’ll have nailed their results each year, when in reality I couldn’t hit water if I fell out of a boat, just got lucky on either side.
Drilling a bit further into the components of the chart, I tracked all of the “actual misses” by 15 spot increments to see at a micro level how reliable the predictions have been.
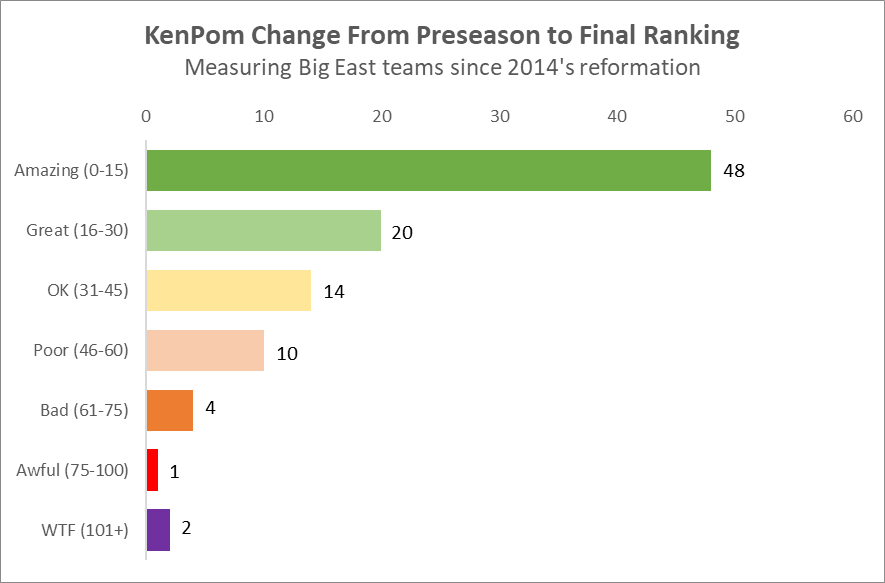
Here’s another way to represent the same data.
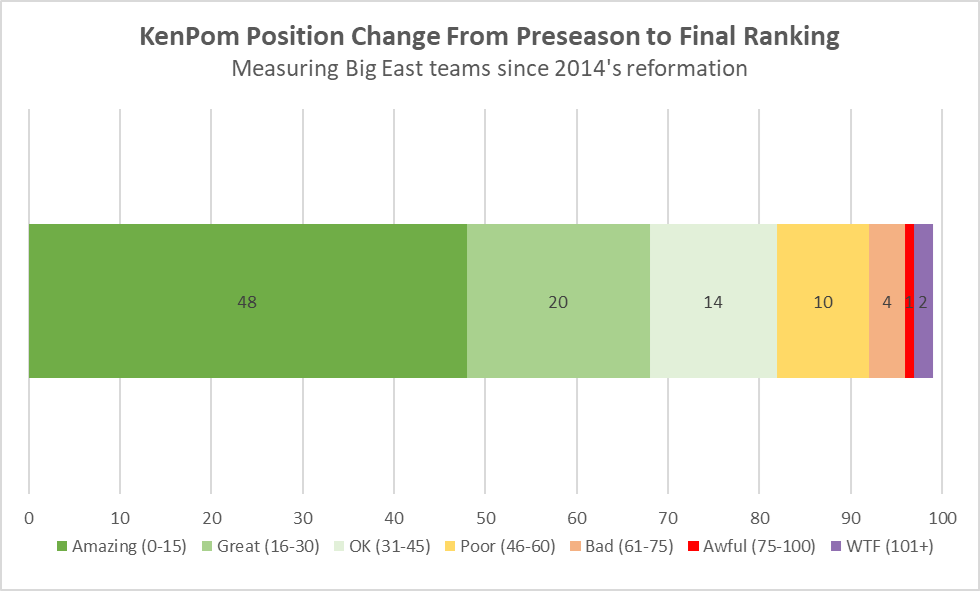
This visualization does a great job of representing how overwhelmingly accurate KenPom preseason ranks are, compared to the final ones. Despite working in universe of 350+ teams, nearly half of the 99 predictions have been within 15 spots of the predicted one, and 68% have been within 30.
Of course, predicting a team will be 5th and having them finish 20th is much less impressive than a prediction of 80 landing at 65, so it’s not exactly equal.
Focusing just on the top 20 predictions for Big East teams, KenPom’s site has logged 19 such projections, and 13 have hit within 10 spots. In fact, Georgetown in 2014 and UConn in 2015 were the only 2 top-20 prediction to miss by over 30 spots. That is to say, when KenPom tabbed a team as part of college basketball’s elite, they finished as such about 70% of the time.
Which gets us back to our original point. No system is going to be perfect. There are too many variables across 350+ teams over 6+ months that no algorithm will be able to model with perfect accuracy before even a game is played. I think that’s Kevin’s original complaint.
But as the NET releases in early December show us, not putting in baseline projections for the model to use as a reference point leads to some absurdly illogical results. Having this baseline in place lets us examine data with a bit more confidence, knowing that over half the time, these preseason inputs turn out to have tremendous forecasting power. As more real game data rolls in, the preseason prior will be lessened until it’s nonexistent in the formula.
So all of this is to say, if you want to be mad about your team’s preseason KenPom rank, go ahead and tilt at windmills. Just do so knowing you’ll only be right about 30% of the time.
Random Stats
Least Variance: Villanova is a machine.
Hardest to Peg: Butler has had five seasons with 40+ spot movement, 4 of those in the negative direction
Biggest Underachievement: UConn in 2018, missing preseason predictions by 110 spots.
Biggest Overachievement: Providence in 2022 and Seton Hall in 2016 each moved up 53 spots.
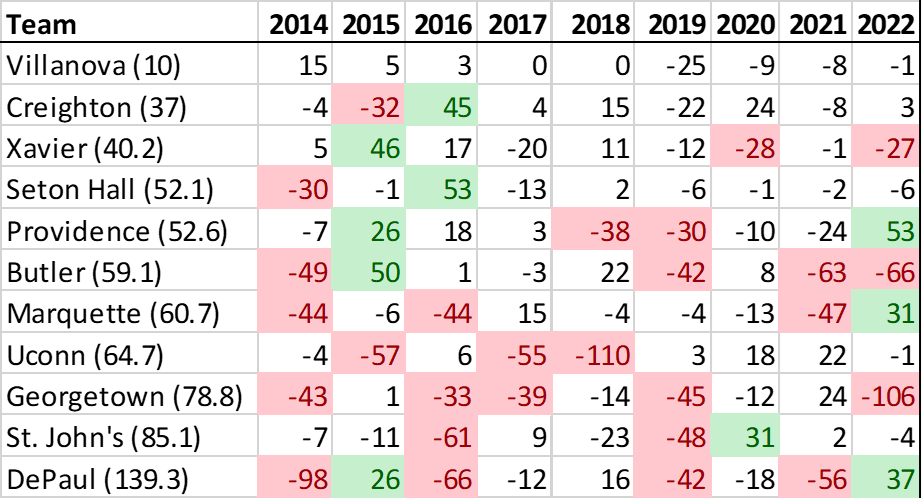
Finally, here’s the same chart, but highlighting big underperformance in red and big overperformance in green.


Leave a comment