We spend 3 to 4 months leading up to the season obsessively clicking on every way-too-early ranking, parsing each useless projected March Madness bracket and otherwise binging on any morsel or blurb mentioning our favorite team. But by December, all of those hours spent angrily yelling on Twitter about perceived slights are pretty much forgotten about. And by March there will be 0 recollection of those efforts, only to be repeated once more the minute a new champion is crowned.
With that in mind, I’ve made a habit of logging projections I run into over the summer and fall the past few years, and being a Marquette blog, focusing mostly on the Big East, in order to do a better job of putting on-court results in perspective with media expectations/predictions. This isn’t meant to be a gotcha to any specific outlet, but rather help publicize what the consensus was before the season started.
Below you’ll find two tables, one with Big East order of finish projections from 1 to 11, and then DI projected ranks (most all the way to 360+, but a few only the top-100).
Big East Projections
Here are the Big East results for projected order of finish.
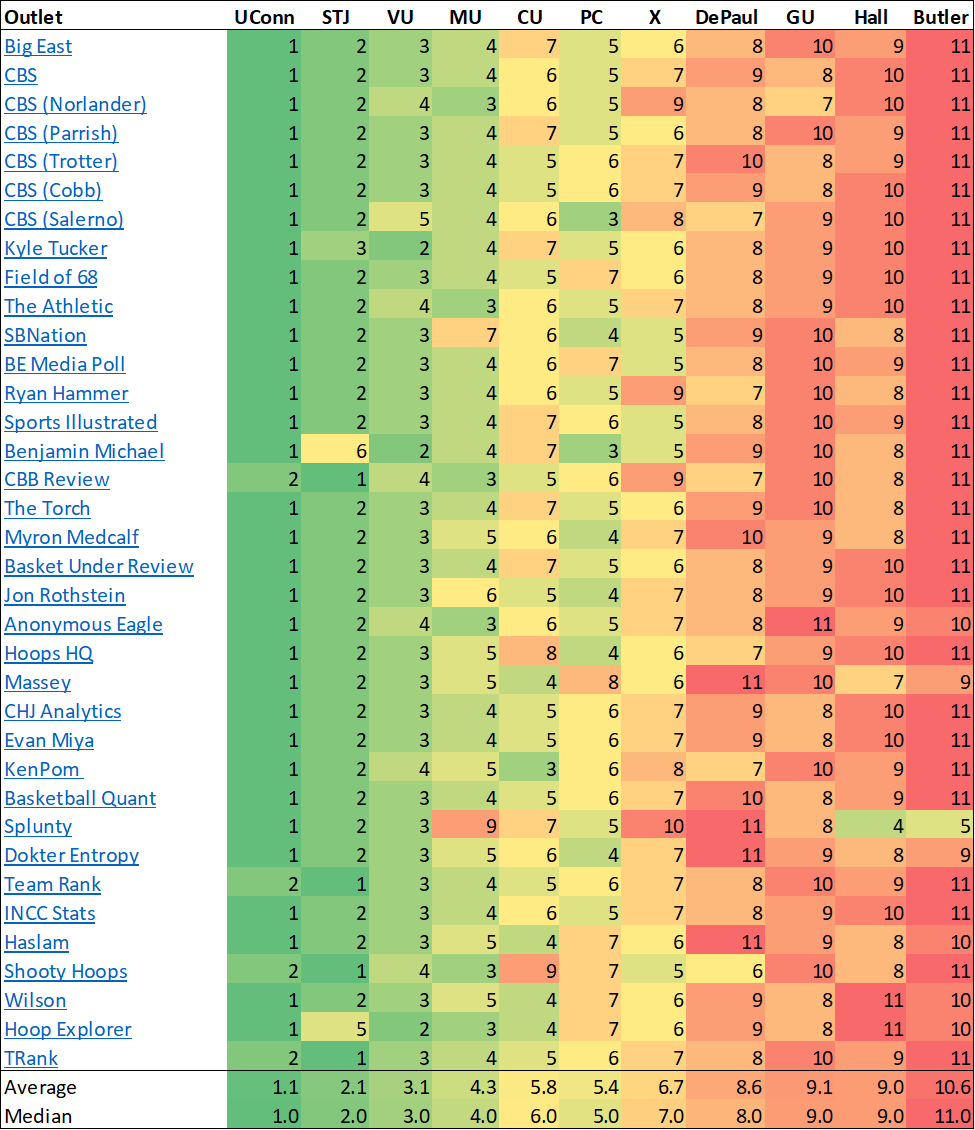
My personal favorite bit is the Splunty model putting green where only red and orange exists for Butler. Of the 31 sources, it’s the only one to not have the Bulldogs in the bottom 3, placing them 5th overall. (It also has Marquette 9th.) I don’t mind outside the cell thinking, but this is one to remember come Spring.
And here’s a tidy recap of each team’s projections. Seton Hall has the widest range of possibilities, with a range of 7 spots from best to worst.
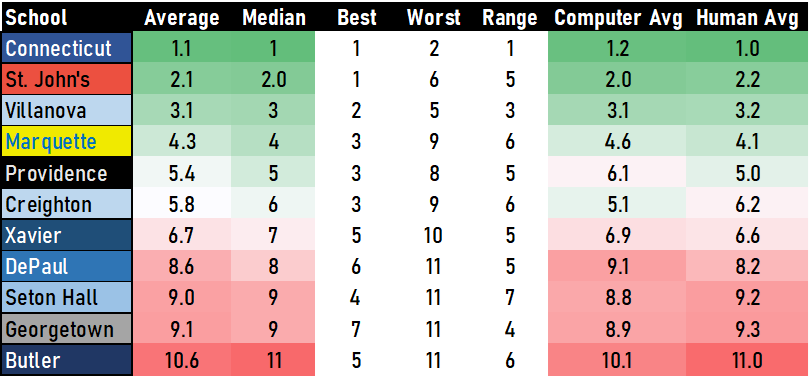
The biggest callout for me is that it seems like Providence and Creighton are the inverse of each other. Both are expected to finish around 5th, but the human and computer projections have them swapped. For the Friars, the computer model average of 6.1 is a full 1.1 points worse than where the humans have them, while the algorithms are bullish on Creighton (5.1) compared to the humans. The fact both teams will have new coaches and very different rosters makes it difficult to say which I trust more, but still quite interesting how the averages split so neatly for both.
Full NCAA Projections
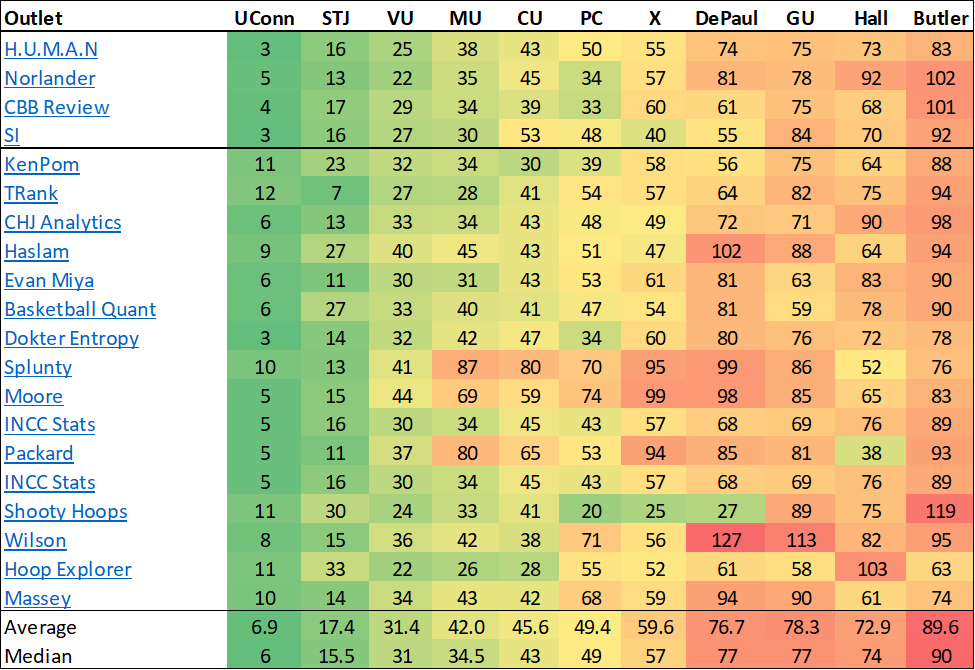
For the DI rankings, we don’t have quite as robust a sample (though I will continue to update this post publication), but we get much more variations on the result.
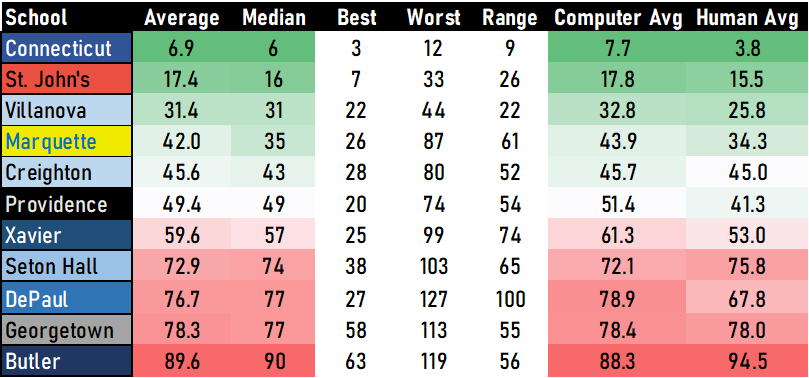
And this is how the recap looks, with a focus on how the computer and human models differ when it comes to Georgetown, with humans 22 spots higher on average than the computer models.
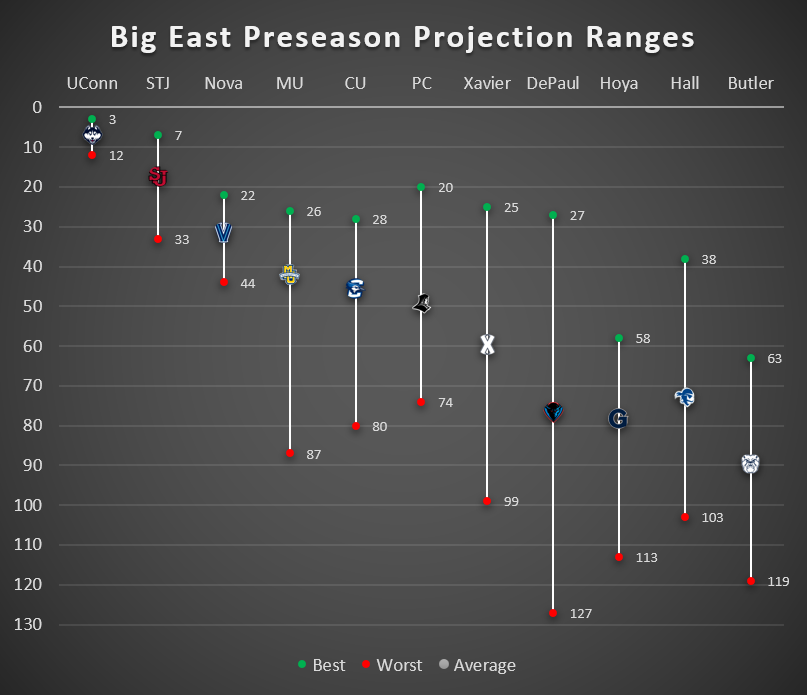
One final chart, I love to visualize not just where teams are projected, but what that range of projections looks like in a graph. The logo is on the average while the other end points are the highest and lowest projections.
Takeaways
- Marquette is the biggest disagreement among the upper-half teams with an average of 42 and a median of only 34.5. There are some very bearish projections that are doing some heavy lifting to bring the overall average down.
- The unanimity on UConn’s projections is another reminder of how high that program is flying.
- There’s been a lot written about the money the Big East teams have invested into their rosters, but for it to pay dividends, the middle tier from Villanova to Xavier will have to land on the top end of these projections. Finishing with 4/5 teams around 50 makes for a stronger league than last year but not necessarily one that will result in more bids.
- DePaul’s range is fascinating. I’m personally more bullish than even their average, but I guess the decades of futility are hard to overcome in a model.
- As always, we will continue to compare results to these projections throughout the season.
Feel free to send any questions of complaints my way in the comments or to @PaintTouches on Twitter.
Make a one-time donation
Choose an amount
Or enter a custom amount
Your contribution is appreciated.


Leave a Reply