Marquette has had a fairly horrific start to the season from a shooting perspective, combining to shoot a miserable 28.6% from distance through the first 5 games. That ranks 286th in the country as of Nov. 20, and is easily the worst start for a Marquette team under Shaka. (See the red line below.)
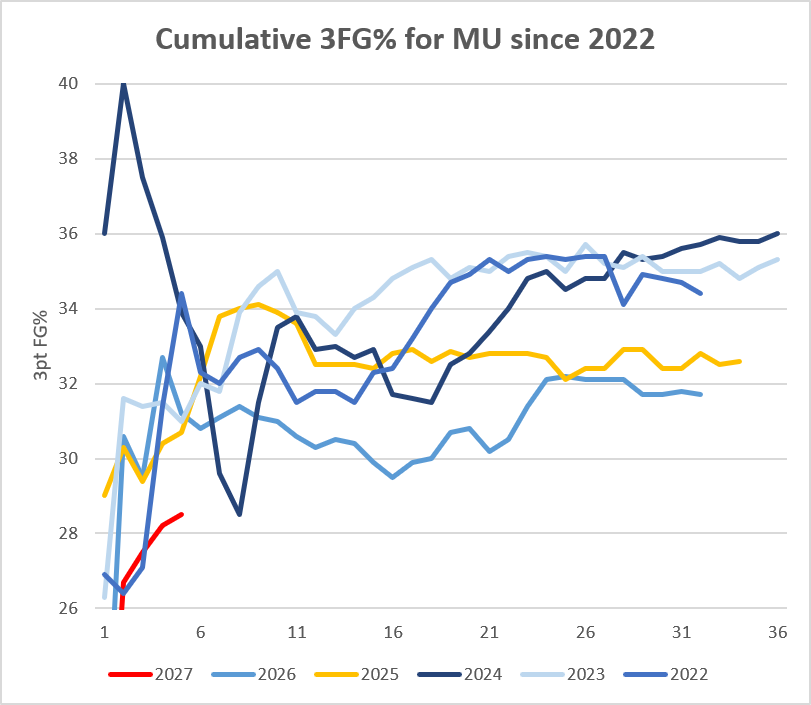
Now, 3-point shooting is particularly noisy and one or two outlier games can have a lasting effect for the medium term. So looking a bit deeper under the hood to get a better picture of what is happening, Marquette is doing particularly poorly on the easiest shots. Of its 140 3s taken so far, 53 have come via unguarded spot up jumpers. These are the best 3s you can take and this is an area where last year’s team that finished in the bottom quartile of all of D1 actually excelled, connecting on 39.7%, which ranked 91st in the country.
This year, these high quality looks have yet to be cashed in, with Marquette making only 28% of them, ranking 320th in the country. That would be bad enough, but combined with the 27.7% shooting on guarded spot ups and 29.3% shooting on dribble 3s, there’s no where to even squint and say improvement is on the way. But it’s still early and there is historical precedent that shooters like Michael Phillips (1/10) and Nigel James (1/5) can revert closer to their freshman year numbers.
But that got me thinking to a few comments I’ve seen of late that noted Marquette’s players seem to all regress when it comes to shooting. We don’t normally see players break out as shooters by staying with the program, and instead actually see the bottom fall out, with cases like Kam Jones and Chase Ross and Ben Gold as seniors all coming to mind. So I had to do a bit of digging. I mapped out every season from 2022 through 2026 and sorted the percentages by player and class year.
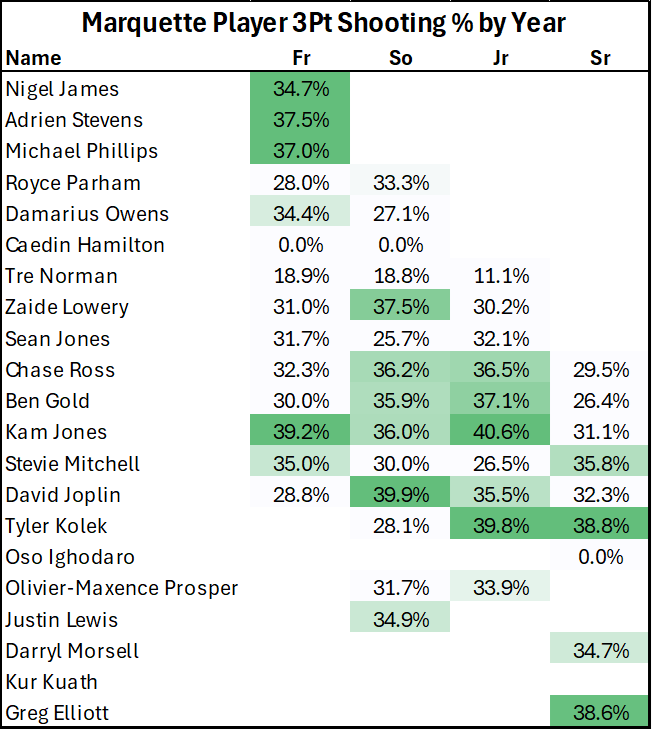
As a whole, this does an ok job of showing that there has been a cohort of seniors for whom the bottom absolutely dropped out in a why that makes no sense compared to their early career numbers. But even in these cases, there had been progression the prior years, so it’s not accurate to say there is no development.
Still, if you take the average across all class years, you do see that there is no clear trajectory, which is jarring.

But personally, I don’t think 3pt% is a great barometer in this case because it doesn’t consider volume at all. It’s much better for the team as a whole to shoot a bit lower on much higher volume than to keep shots low, and percentages high. This was the whole basis for my #8aGame campaign after Markus Howard’s record setting freshman season. Yes, hitting 54.7% of threes is still jaw droppingly good, but I wanted him to take way more than 4.8 of them a game, even if it meant making them at a lower clip.
As players grow into a system, they usually take on larger roles, which means not only more minutes, but a higher usage rate offensively. This additional volume should be a accounted for in some way. That concept has always been difficult to conceptualize, let alone measure, but this is where the awesome analytics site CJH Analytics has come in clutch. (Feel free to gloss over the next section if you don’t care about the sausage making.)
SHOOTR Production
Colin Hanley, the site’s creator, devised a metric that incorporates both volume and efficiency, and then puts it in perspective to the national average. He takes the number of 3 pointers a player makes per game, and multiplies that by the result of dividing that player’s 3pt% from the D1 average.
SHOOTR PROD. = 3PM/G × (3P% / league average)
There is no math test here, but laying out the formula makes it clear what this is trying to measure. It’s not just what percentage of 3s you hit, but rather how favorable that percentage you hit is compared to everyone else, multiplied by the number of 3s per game you actually hit per game.
And to put it into action, suppose the national average is 35%.
Two players both make 2 threes per game:
- Player A shoots 40%:
2 × (40% / 35%) = 2.29 - Player B shoots 30%:
2 × (30% / 35%) = 1.71
So the efficient shooter with the same volume gets the higher SHOOTR score.
And now imagine 3 players shoot the same percentage but have different volumes:
- 40%, 1 make/game → 1.14
- 40%, 2 makes/game → 2.29
- 40%, 3 makes/game → 3.43
This is rewarding players for both efficiency and volume. And the best part is, we have data going back to 2011, so we have over 15 years worth of samples to truly get a feel for how it works. As an example let’s use the greatest shooter of our lifetime, Markus Howard, again.
Below you can see we’ve sorted the SHOOTR results from best to worst, and it has his 2020 season head and shoulders above his 2017 season, despite a 13.5% point decrease in 3pt%. Again, this isn’t to say a high 3pt% is bad, it’s simply adding the context that Markus’ volume doubled and he made 1.6 more 3s a game.
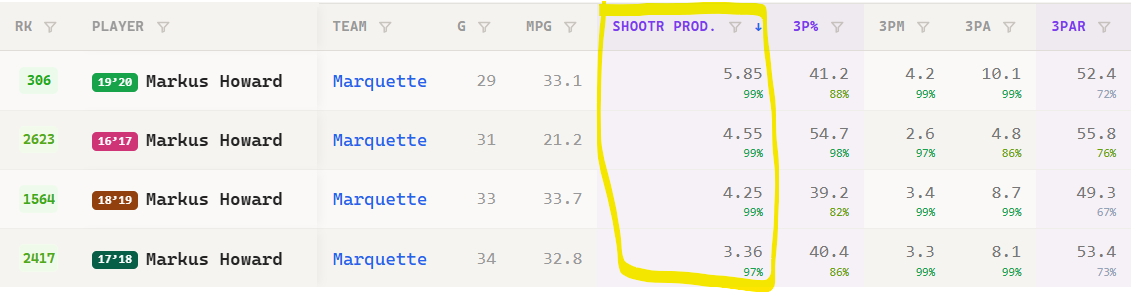
So one last time, this metric gives us a way to contextualize 3pt% with increased minutes, roles and volume.
SHOOTR progression under Shaka
This brings us back to the point of the article, do players actually develop as shooters under Shaka? I took the same style of chart as above and tried to visualize exactly how much growth was happening in his Marquette tenure.
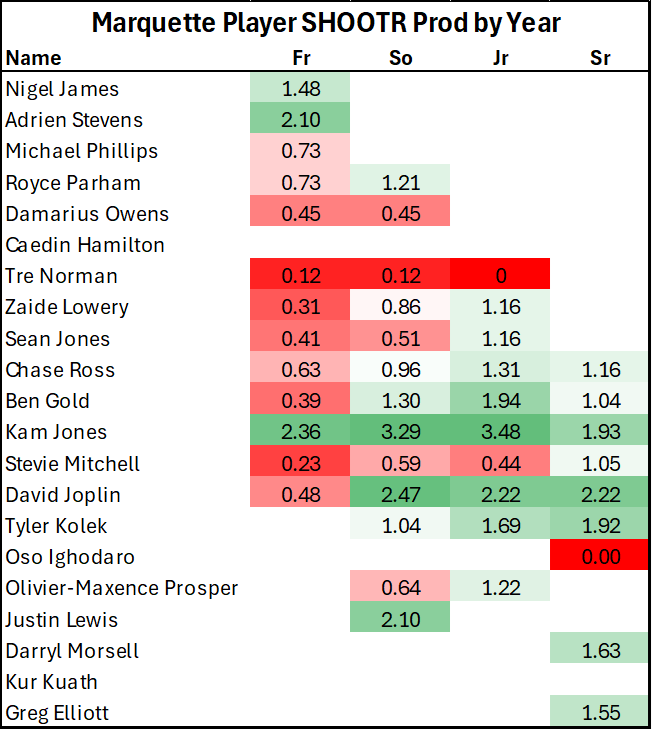
You can check out some of the individual patterns, but putting it together we get this progression by class:

Whether you go by average or median, there are clear linear improvements from freshman to sophomore year, and then from sophomore to junior year. However, there were pretty deep downturns as seniors, with only Stevie Mitchell and Tyler Kolek seeing a modest increase.
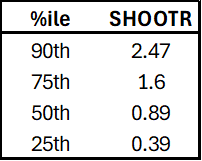
So what do we make of all this? I think it’s unfair to say the shooting always regresses or players aren’t improving. On the whole, using SHOOTR allows us to map out that improvement. And to put it into further context, 0.89 was the 50th percentile outcome from almost 24,000 players in the sample.
Put it all together and I think we can say with some confidence that Marquette’s program has seen players progress into better than average shooters, with volume considered, but only a few actually became great shooters.
We don’t know exactly how the rest of this season will play out, and it’s much to soon to make any definitive assertions about anyone based off 5 games, but once we get into Big East play, we’ll update the chart with the 2027 preliminary numbers and add a decent amount to the sample.
TL;DR
Marquette players do improve as shooters, once you factor in volume, but that progression seems to level off and regress for those that make it to senior year.
If you’d like to learn a bit more, I highly recommend playing around with it yourself: https://cjhanalytics.com/players#search=marquette&mpg=0&g=5&cols=team.games.mpg.tpr.fg3pct.fg3m.fg3a.fg3ar.ts.efg.fgpct.ftpct.rimr.midr.rim.mid.ftr.fgm.fga
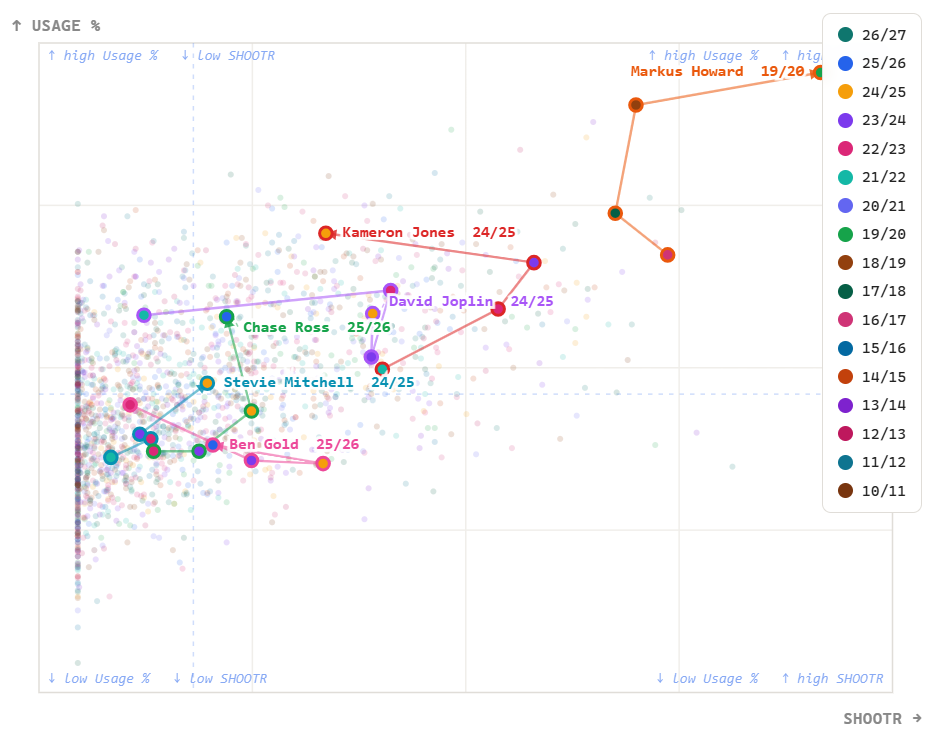
Last thing, here’s a visual version of SHOOTR progression for a few Marquette players that stayed all 4 years under Shaka, plus Markus, because I will never stop gawking.
Make a one-time donation
Choose an amount
Or enter a custom amount
Your contribution is appreciated.


Leave a Reply