I make a note of rounding up all the preseason projections before the season starts, to be able to gauge what the national, unbiased consensus is and to be able to measure against at the end of the season. And although there are still a few games remaining that will have minimal impact on the final rankings, (like Nova/Penn St. results), I didn’ want to wait another week to start the postmortems.
Unlike last season, it appears that Marquette has fallen a bit behind the expectations laid before it, expectations that already lagged what Marquette affiliated bloggers and media set down.
Sports Illustrated
Expectations: 45th (7th in BEast)
Actual: 56 (7th in BEast)
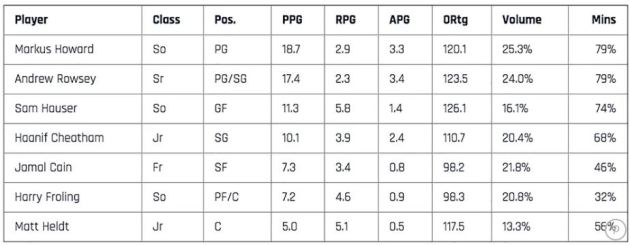
Sport’s Illustrated’s model by Dan Hanner is detailed enough to give you the exact breakdown per player, so it’s even more useful to see how those projections fared against the actual results.
| Player | PPG | RPG | APG | Ortg | Volume | Mins |
| Andrew Rowsey | 20.5 | 3 | 4.8 | 118.3 | 29.4 | 80.8 |
| Sam Hauser | 14.1 | 5.7 | 2.9 | 130.4 | 20.8 | 80.6 |
| Markus Howard | 20.4 | 3.2 | 2.8 | 114.5 | 32.7 | 75.7 |
| Sacar Anim | 7.6 | 2.8 | 1.6 | 104.5 | 15.6 | 66.7 |
| Matt Heldt | 3.9 | 4.7 | 0.7 | 138.2 | 7.5 | 54.3 |
| Greg Elliott | 4.5 | 2.3 | 1.4 | 116 | 11.4 | 45.2 |
| Jamal Cain | 4.6 | 3.4 | 0.6 | 101.8 | 14.2 | 41.3 |
| Theo John | 3.9 | 2.3 | 0.2 | 91.7 | 16.7 | 27.6 |
| Harry Froling | 2.8 | 3 | 1 | 99.7 | 15.3 | 17.5 |
| Haanif Cheatham | 8.2 | 2.8 | 1.4 | 94.3 | 19.2 | 9.3 |
Obviously the loss of Haanif Cheatham early in the season took a big hit, but Sacar Anim, who wasn’t even listed on the preseason projection was able to take up almost all of those minutes, though with lower volume and a bit lower efficiency. The rest of that volume, and then some, was taken by Howard and Rowsey, who way overshot the projections, and that did seem to negatively affect the overall ORtg for both. Hauser was and is the unicorn who both beat the volume and (sky high) ORtg projections set before him.
As a whole, Marquette did perform below expectations, as SI was the only projection that had MU making the NCAA Tournament as one of the First Four teams.
T-Rank
Expectations: 25 (4th in BEast)
Actual: 53 (7th in BEast)
CBS Sports
Expectations: 56 (7th in BEast)
Actual: (7th in BEast)
On the one hand, Nordy nailed the results. On the other hand…
A fun program, and Wojciechowski’s going to keep it steady, but probably an NIT year. The schedule is plenty challenging, and I like that a lot. I’ll eat crow if MU winds up winning at least two in Maui, and is able to take the game vs. Wisconsin. Do that, then the NCAA Tournament picture changes significantly for this program.
NBC Sports
Expectations: (6th in BEast)
Actual: (7th in BEast)
With Andrew Rowsey and Markus Howard among the returnees, it’s known that Steve Wojciechowski’s team can put points on the board. But can they be more effective defensively?
Well, guess we answered that question.
KenPom
Expectations: 49 (4th in BEast)
Actual: 56 (7th in BEast)
Jeff Sagarin
Expectations: 54 (7th in BEast)
Actual: 51 (7th in BEast)
Team Rankings
Expectations: 53 (8th in BEast)
Actual: 49 (7th in BEast)
ESPN BPI
Expectations: 33 (5th in BEast)
Actual: 53 (7th in BEast)
Yale
Expectations: 31 (5th in BEast)
Actual: 47 (7th in BEast)
Athlon
Expectations: (7th in BEast)
Actual: (7th in BEast)
Blue Ribbon, Lindy’s, Street & Smith
Expectations: (7th in BEast)
Actual: (7th in BEast)
During early Fall last year, I noticed there was a split between the human projections and the early computer models.
The later ones like KenPom, Sagarin and SI/Hanner seemed to get much closer to Marquette’s final position. I’m not sure what the difference was between the early (TRank, Yale, BPI) and the late models was, but I’ll be sure to keep that in mind going forward.
In any case, the overall picture painted of Marquette prior to the season was right on the money. MU was a tad worse than expected, but well within the margin of error for most.


Leave a comment