(Photo by Ryan Messier/Paint Touches)
Seton Hall hasn’t lived up to preseason expectations this year, but they haven’t exactly been a pushover. With a top-50 KenPom defense and a top-35 KenPom offense, they are balanced and can pose problems to pretty much every team they play with their experienced roster.
But then they play Marquette and it all falls to pieces. This being a Marquette blog, my focus is on the Warriors rather than the Pirates, but the question remains, what is it about Marquette that allows it to play against a pretty tough opponent in Seton Hall so well?
Again, Hall is no pushover, yet Marquette’s only two wins against top-50 KenPom opponents are against the Pirates. Marquette isn’t a particularly good rebounding team and Seton Hall feasts on the glass, yet the roles seem reversed every time they faced off this year. My cursory glance at KenPom didn’t yield results, so I turned to Synergy to see what it could produce.
And I’m not positive, but I think it shed some light as to Marquette’s Big East results to date. Take a look at this chart of Big East teams ranked by P&R offense, including passes (so not just ball handling and rollers, but spot ups resulting from P&Rs).
| # | Team | % Time | Poss | Points | PPP |
| 1 | Creighton | 23.80% | 457 | 465 | 1.018 |
| 2 | Villanova | 21% | 395 | 402 | 1.018 |
| 3 | Marquette | 31.60% | 602 | 608 | 1.01 |
| 4 | Xavier | 20.40% | 415 | 412 | 0.993 |
| 5 | Butler | 31.60% | 635 | 592 | 0.932 |
| 6 | St. John’s | 30.80% | 623 | 561 | 0.9 |
| 7 | Providence | 17.30% | 336 | 290 | 0.863 |
| 8 | Seton Hall | 24.70% | 490 | 420 | 0.857 |
| 9 | Georgetown | 17.20% | 333 | 274 | 0.823 |
| 10 | DePaul | 21.10% | 409 | 326 | 0.797 |
Hmm those bottom four teams look mighty familiar. They are the only Big East teams Marquette has wins against in conference play.
Now take a look at this chart from TRank on PPP per game allowed throughout the season.
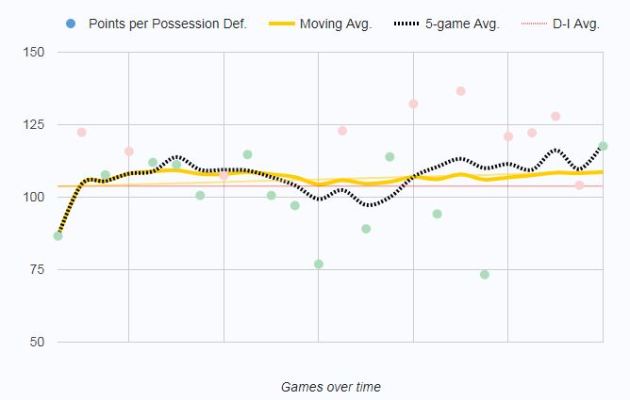
Would it surprise you to find out Marquette’s best 6 defensive Big East games from a PPP perspective came against DePaul, Georgetown, Hall (2x), and Providence (2x)? Of course not. And what do you know, the 4 worst teams in terms of P&R offense are the same ones listed above.
It isn’t surprising at all. It’s pretty obvious to anyone who has watched the past two years that Marquette struggles against good/great P&R offenses from both a scheme and personnel perspective. I harped on it over and over last season. Currently Marquette ranks 331st in the country allowing .987 PPP on defensive P&R possessions (including passes). That’s a slight improvement from last year’s ranking of 342 and 1.003 PPP, but not much.
So why are the results (slightly) different this season? The offense isn’t quite as good or efficient. If the offense isn’t running on all cylinders, it all falls apart. Marquette is 2-6 in games it scores less than 1.038 PPP, the D1 average. And wouldn’t you know it, those two wins came against the two worst Big East tams in terms of P&R PPP, Georgetown and DePaul.
Again, this isn’t exactly rocket science, it is and has been obvious for two years now, but the correlation hasn’t been outlined so clearly to the best of my knowledge.
What does this mean going forward? Of Marquette’s final 6 games, 4 come against teams in the bottom half of the Big East in terms of P&R PPP. The other 2 are against the best P&R team in the conference. Winning 4 of 6 is absolutely necessary to even stay in the conversation for a Tournament bid, so each of the non-Creighton game becomes a near must-win, starting with St. John’s on Saturday.
That’s not to say Marquette can’t beat Creighton, as it’s played two of its best games of the season against Villanova. Creighton is also worse defensively in overall terms and P&R terms than Villanova. However, it does mean there is 0 margin for error offensively. If Marquette doesn’t shoot the lights out, it won’t win and it probably won’t be close (see the 2nd Xavier game).
This has everything to do with Marquette’s defense and the opponent’s P&R offense. As you can see below, there is no real correlation between an opponents P&R defense and Marquette’s offensive performance.
| # | Team | % Time | Poss | Points | PPP |
| 1 | DePaul | 24.70% | 460 | 363 | 0.789 |
| 2 | Georgetown | 34.50% | 656 | 524 | 0.799 |
| 3 | Villanova | 24% | 454 | 365 | 0.804 |
| 4 | St. John’s | 22.30% | 461 | 372 | 0.807 |
| 5 | Providence | 24.30% | 473 | 384 | 0.812 |
| 6 | Butler | 26.90% | 529 | 433 | 0.819 |
| 7 | Creighton | 28.60% | 551 | 473 | 0.858 |
| 8 | Seton Hall | 27.70% | 538 | 467 | 0.868 |
| 9 | Xavier | 28.50% | 578 | 529 | 0.915 |
| 10 | Marquette | 28.40% | 544 | 537 | 0.987 |
Marquette will be playing for its Tournament life from here on out. The P&R defense will end up telling the tale of whether it dances or not.


Leave a comment