It’s been almost week since the schedule was revealed, and though the initial outcry has subsided, questions still remain.
https://twitter.com/ChrisDobbertean/status/621730102208925696
I will be speaking to Deputy AD Mike Broeker next week to get more perspective and insight into the schedule for this year, but in the meantime, I’ve been researching how the schedule compares to previous years. Seeing all those 300s next to opponents KenPom ratings is ugly, but is it indicative of how they will perform this year? After all, the numbers we see now refer to last year. Marquette finished the year ranked 110 in the KenPom ratings in 2015, does that mean it will finish there in 2016? Of course not. Teams improve.
With that in mind, I dug into the past 5 years of non-conference schedules using basic averaging of KenPom ratings, as I think they are more accurate than the RPI, but in any case, are much easier to work with when comparing multiple seasons. The results show three points quite clearly. 1) Broeker and the basketball staff that handles scheduling are amazingly accurate with their predictions of where the non-conference schedule will land in terms of average difficulty. 2) This is by far the worst non-conference schedule Marquette has put together since 2011. 3) The biggest contributor to that overall weakness lies with the buy-game scheduling.
Let’s dig in to the data to flesh out these points.
The staff knows what it’s doing and is really good at it
Since 2011, Marquette’s average non-con opponent ranking going into the season has been almost identical to the average final ranking of those opponents. What that means is the staff has a very good feel for which teams will be good and which teams won’t, and schedule accordingly. Here are the numbers:
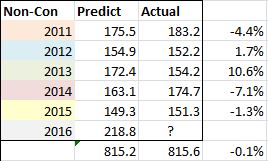
The predict column is the average of the ranking of all the Non-Con opponents from the year before (so the numbers we are currently discussing for the 2016 season). The actual is where that average ended up. Although we see fluctuations every year, on the whole, they don’t overestimate or underestimate by much, if at all.
(I do realize the limitations to applying such crude mathematical equations (a simple average) without weighting. If you play a team ranked 201 and one ranked 1, the average is 101, though the probability of winning both games much higher than if you played teams ranked 100 and 102. Also, it doesn’t factor added emphasis for road games, which are much more difficult to win than home games. This is just a simple, broad view for comparison purposes.)
The non-conference schedule is the ugliest it’s been since 2011
Here is a deeper breakdown of the non-con schedules, again using simple averages to get the data points.
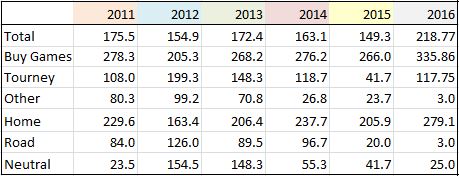
One thing that stood out while compiling the data is the dearth of home and away series and neutral site, non-tournament, games. There were two last year (OSU, ASU), three in 2014 (OSU, ASU, New Mexico), three in 2013 (LSU, OSU, Green Bay), three in 2012 (Washington, LSU, Vanderbilt), and two in 2011 (Vanderbilt, UWM). There aren’t any this year. These are games that will definitely test a team (loss and GB and near-loss at UWM) and will generally pit high majors together. Those two games that fans are used to seeing are completely gone now, and have been replaced by cupcake buy-games. That’s why there is such a lack of excitement for the schedule as it stands.
The Legends Classic Tournament MU will partake is right about average, but may be one of its toughest ones yet. (For the sake of the chart above, I assumed the two Brooklyn games would have an average rating of 25. LSU and NC State both should be well within that range, while ASU below 50.) Belmont will very tough to beat, while there will be at least one top-25 team awaiting at Barclays. Overall, this is a great test for a young squad, learning on the go.I
I already touched on the lack of series, so the only other tests are the annual tilt with Wisconsin and a Gavitt Games match-up with Iowa. Neither team will be as strong as it was last year, but both project to be better than Marquette, so it again works out well for MU.
That leaves one part of the schedule left …
The buy games are awful
There’s no easy way around it. Not only are they awful, there are 7 of them, the most in the 5 years I analyzed. (To be completely fair in this analysis, I didn’t count the UWM or Green Bay series as buy-games as they were part of a longer series that included an away game)
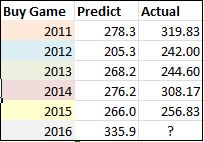
As you can see above, the average rating of the buy-games this season is 57.6 spots lower than the worst year (2011). That’s bad, but what’s even worse is that predicting buy-game opponent strength is the staff’s most negatively variable component. In other words, the KenPom rankings from the year before overestimate the strength of each the buy game opponents by an average of 15 spots. Again, in 3 out of 5 years, the scary numbers got worse. On the positive side, that almost literally can’t happen this season. But this cuts against the talking point that teams get better and its not fair to analyze this year’s opponents on last year’s numbers. They do get better, and they will, but not enough to offset the heavy weight that is 7 cupcakes.
If you want to take a look for yourself, here is every buy-game opponent from the last 6 years in one chart. It’s color coded by year and sorted by weakness of opponent based on the previous year’s KenPom ratings.
![]()
As you can see, 5 of the worst 7 opponents Marquette has scheduled the last five years will come this season.
How/whether this will negatively impact Marquette can be debated at length, but there is no denying that the non-conference schedule is the weakest in recent memory.


Leave a comment