We spend all summer and fall putting together projections about what 30+ people and computers think will happen in the upcoming season, but then rarely go back to them as soon as the ball tips in November. So we wanted to make sure we took a few moments before the March chaos to compare the end of the regular season to the projections.
Did you hear MU was picked 9th?
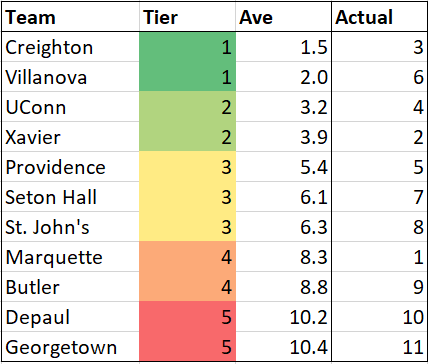
Well, the composite had them 8th, but the joke stands. Here’s how each individual we tracked had them.
To be honest, the composite Big East standings only had 2 big misses. MU jumping into the first tier with Villanova dropping into the middle tiers. This is why it’s smart to see the projections not in isolation, but in aggregate.
It’s also a good reminder that they are not the end all be all.
Massey Composite
We’ve tracked this chart all season, and the final installment does not disappoint.
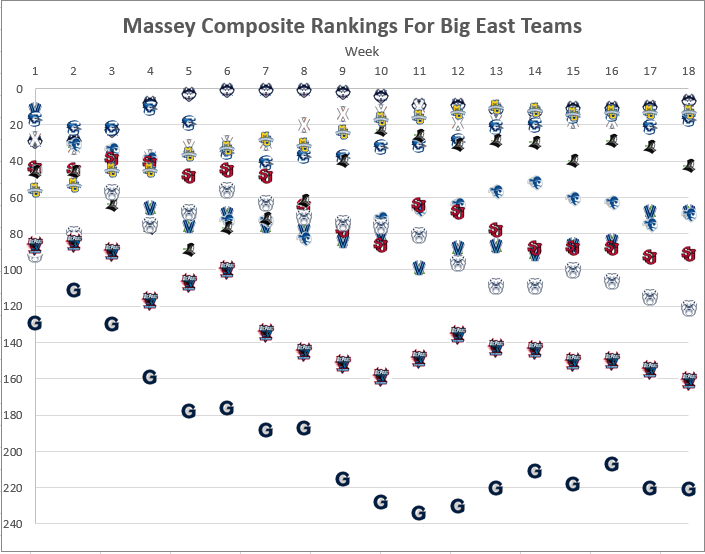
Georgetown and DePaul were expected to be bad, but this level of badness was not forseen.
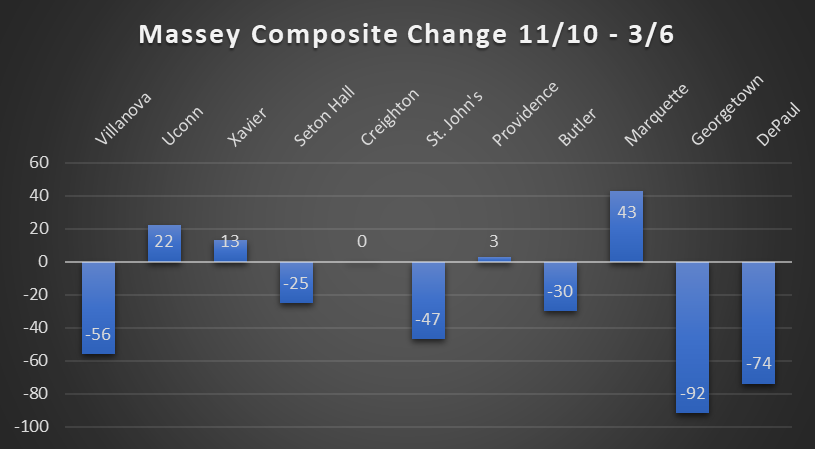
The Big East as a whole had a lot more underperformance than positive surprises this season,
Individual Ranges
But as important as composites are, it’s also good to see the range of individual projections that make up the average.
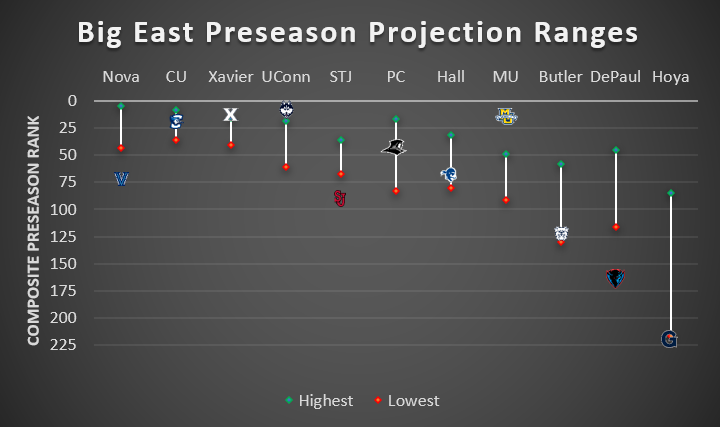
Nobody in the country had Marquette in the top-40, and yet they finish in the top-15. Similarly, nobody envisioned Villanova or DePaul being quite this bad.
Here were those projections by source.
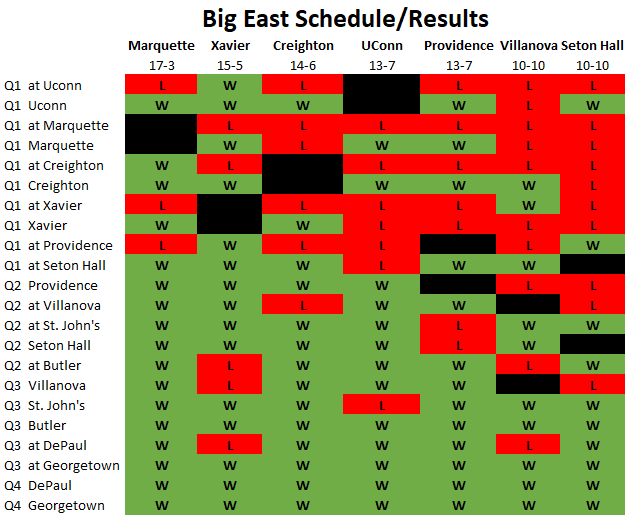
Road to Glory
If you need a reminder of how Marquette got to the summit, here is the map of results organized by difficulty of game. Only MU was able to hold serve at home as well as navigate all of Q2 and Q3 unscathed.
And finally my favorite chart in the world. Every morning since November, Bart Torvik’s computers run 50,000 simulations of the season and assign probabilities of certain scenarios to occur.
The morning the season tipped off, these models had Marquette winning 17 Big East games exactly 0 times. In fact there were significantly better odds of Marquette winning 6 or fewer conference games (7.9%) than 14 or more (2.4%). Through the first 11 days of the season, on over 550,000 individual simulations, MU’s win total still had never reached 17.
And then what happened?
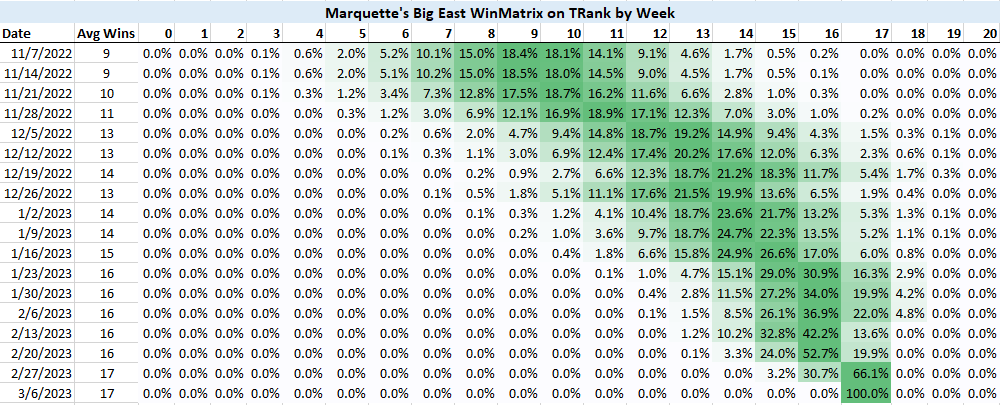
This isn’t meant to say anything bad about TRank’s model, quite the opposite. Marquette’s run through the Big East could not have been predicted by anyone or anything. No matter how bullish the predictions got, it could never quite catch up with Shaka’s squad.


Leave a comment