
(Photo by Ryan Messier/Paint Touches)
We get a lot of emergency PT signals on Twitter asking for stats or data to support a hypothesis here or there, so we do our best to respond in that medium. Sometimes, though, a question is so good, so important, and requires so much work, that a simple Tweet doesn’t do it justice.
Enter Cracked Sidewalks:
Before digging in, we established the parameters for “high leverage situations” as 2-possession games with less than 10 minutes to go in the second half or overtime. This is imperfect because there isn’t much difference between a 6-point game and a 7-point game, so the intensity of the moment might be the same, but tough luck, we had to make the cut somewhere.
With that out of the way, we got to digging. And the results were somewhat surprising for reasons I’ll elaborate throughout.
But right off the bat, did you know that Marquette only had 4 high-leverage defensive possessions combined in its first 5 games? One against Purdue, one against VCU, and two against LSU. The defense did not show very well in this limited sample, allowing 8 points in those possessions, a whopping 2 PPP.
Looking at it so granularity, though, I did gain a level of appreciation for the Eastern Illinois near-debacle. Marquette faced 28 defensive possessions in “high-leverage” situations, and while the results weren’t spectacular, 35 points allowed and a PPP of 1.25, getting this unit reps was important.
Through 9 games, Marquette has given up 75 points in 59 high leverage possessions, a PPP of 1.27. Just like Cracked Sidewalks hypothesized, that is significantly worse than its season (unadjusted) average of 1.09 PPP. That .18 average may not seem like a lot, but extrapolated out for the average number of possessions Marquette plays (71.3), that adds up to about 13 extra points a game.
Using Synergy’s shot chart feature pretty much confirms our back of the envelope data as well. Here is the defensive shot charts using our established high-leverage parameters.
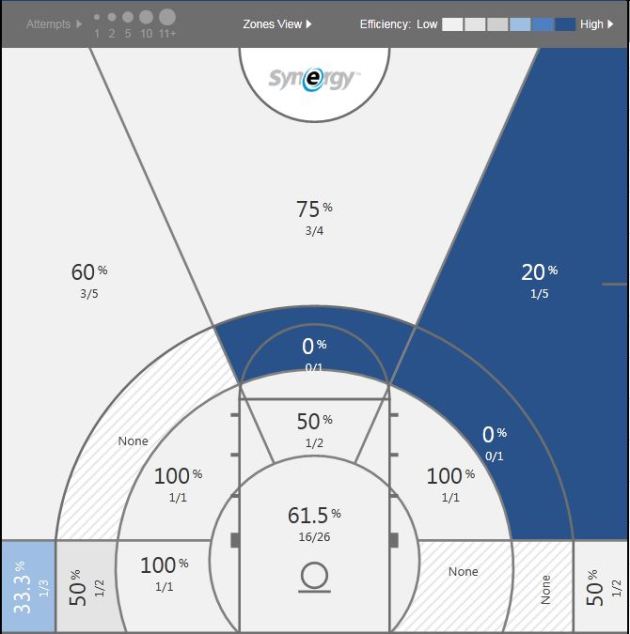 The white/gray areas show which portions Marquette fares below average compared to D1, so just about the entire map. But the shot location, I think, is very important. Of the 54 shots charted, 26 came at the rim, just over 48%. In all situations, according to TRank, 36.9% of opponents’ shots are coming at the rim. So that tells us in the defensive possessions that matter the most, Marquette is much more likely to allow a shot to come at or near the rim and allows opponents to hit over 55% of their shots.
Of course, we can’t pin point the exact cause of the disparity, but this jives with the basic feeling that Marquette struggles (more than usual) to get stops when it really needs them. This in turn puts even more pressure on the already great offense to be near elite.
This isn’t exactly a new problem, either. Synergy notes that opponents took 104 field goals in high leverage situations last season (making 46%), with 49% of the shots coming at the rim. In fact, it was a bigger issue last year, as opponents were only shooting at the rim 31.7% of the time, a wider disparity than this season.
I don’t have a solution. In high leverage situations, both Markus Howard and Andrew Rowsey will be on the court, meaning the defense won’t have any length, athleticism or shot blocking resistance at the perimeter. That’s just the way this team is built.
The freshmen are getting valuable experience, and have shown they can make an impact defensively, but most of that experience won’t pay off until late in this season or next. For now, offense will continue to have to be the best defense.


Leave a comment