If you are reading this blog, you have probably related a bit too much with his A-tier Tweet at some point.
In the moment, Marquette’s result affect my mood, my appetite and pretty much the rest of my day. It’s probably unhealthy, but it’s the truth.
And yet as time progresses, I find that the general ups and downs of a given season are usually replaced by the foggy memories we hold on to, whether good or bad. Which is weird right. I can spend a whole week riding high after a big win, and 3 years later all I’ll remember was the bad result at the end of the season.
So in order to best capture the vibes of any given week, I figured I’d start a running log using the least emotional measurement everyone uses. KenPom. I’ve taken the Adjusted Efficiency Margin he basis his ratings on from every Monday back through 2017 in order to give us some context.
This Year
Weeks like this are exactly why I wanted to do these weekly vibe checks in the first place.
With my eyes, I saw a Marquette team get a historic performance from Nigel James, putting up the most points (38) by a freshman in Marquette history, and pull out a thrilling overtime victory over Providence. The vibes were excellent.
They then followed up that W with a bit of a conflicting loss at Butler. Sure they were a 10-point dog and lost by 11, but they had cut the Butler lead to a single possession with 4 minutes left and had 2 good looks from 3. So the final score wasn’t necessarily representative of the level of play.
In fact, you could say Marquette was a bit unlucky on the whole. It shot 2/12 from 3 on unguarded spot up 3s when it came in shooting around 40%. And Butler shot 4/9 on guarded spot up 3s when it came in shooting 27% on these. Flip 1 from each team and that final minute feels a lot different.
Alas, while I was heartened with the 2 games on the whole, the numbers took a decent size drop, down -0.33 compared to the prior week. And it really had nothing to do with MU’s play. On Saturday morning it had an Adj EM of 4.21, about even to the prior week. But the Maryland, Wisconsin and Seton Hall took big losses and severely impacted MU’s numbers, dorpping .26 points without even playing. That’s an enormous drop for January even with a game, let alone without it.
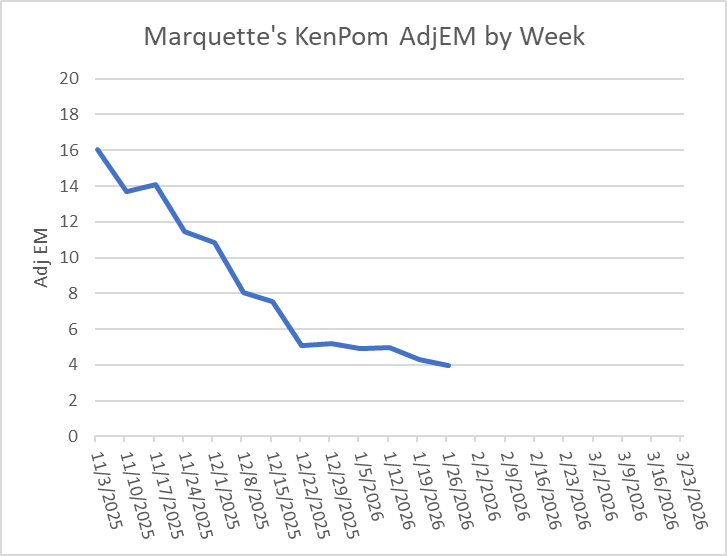
After a few weeks of stasis, Marquette keeps finding new bottoms, even if its not of its own doing.
NCAA Tournament Odds
LOL, remember when I thought this was worth tracking? Marquette has to win the Big East Tournament, so basically 0%.
Player Impact
To make up for removing the NCAA Tourney section, here’s a new part, updating the player performances as measured by Hoop-Explorer’s Player Impact grade in my 2026 dashboard.
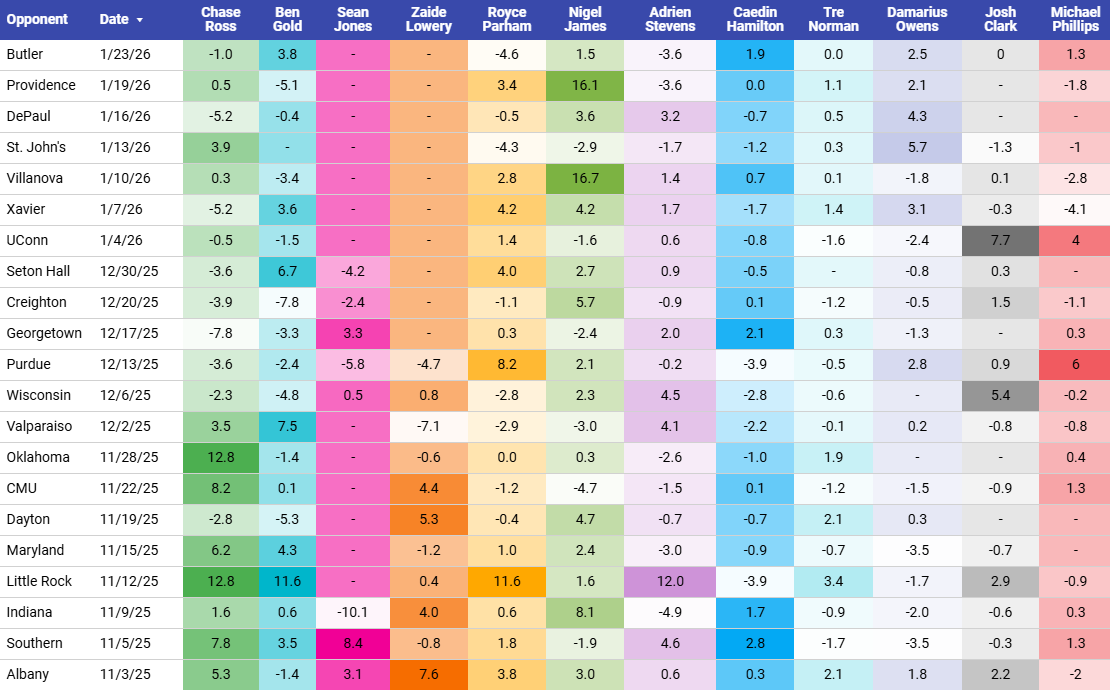
I’ve had a few people ask about Player Impact and the usefulness, and I think a game like Butler’s really shows its value.
In an 11 point loss, you expect players that played big minutes to have pretty bad on/off splits, and MU’s top 3 sure did.
Chase Ross: -14 (38 min)
Nigel James: -16 (37 min)
Royce Parham: -18 (36 min)
You’d see those and say all 3 had equally bad games, generally speaking.
But with Player Impact, using the powers of fancy math, we can incorporate those on/offs with much more information (like box score stats, teammates and opponents). And once we do that we get the following Impact Scores:
Chase Ross: -1.0
Nigel James: +1.5
Royce Parham: -4.6
That was Royce’s worst game of the season, by this measure, which a simple box score look wouldn’t have told us. So again, while the inputs may not be clear and the benchmarks fuzzy, this is a metric that has plenty of utility in small samples, which makes it a really handy tool.
Shaka’s Tenure
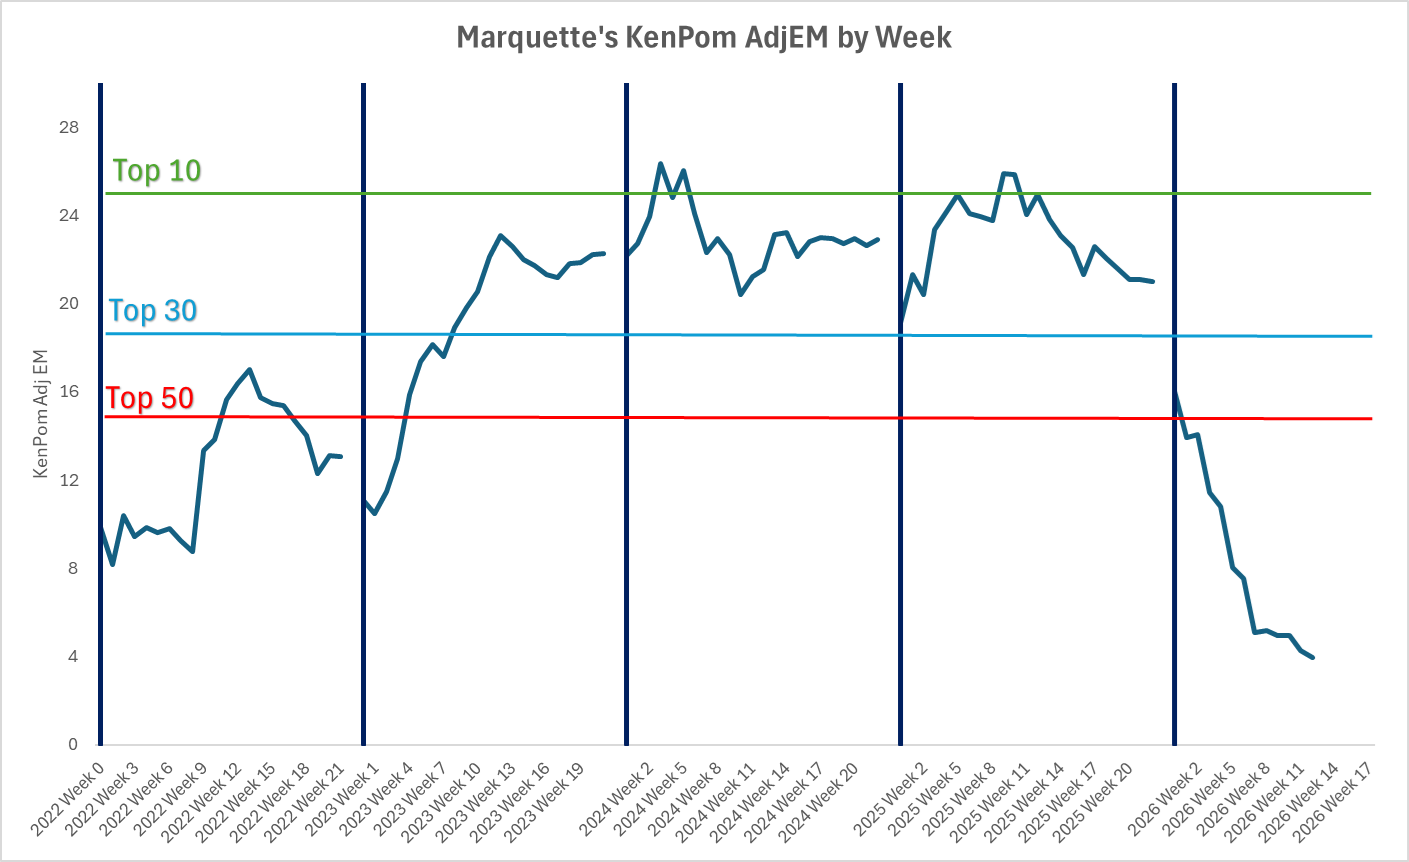
Of course, even though this is meant to highlight a given week’s ups and downs, I still want to throw some context in there. Here’s a look at how Marquette has graded out in KenPom each week of Shaka’s tenure.
(The horizontal “Top XX” lines are set not at any given year, but at what the averages for the 10th, 30th and 50th ranked teams are.)
Marquette is currently at the lowest point in Shaka’s tenure by over 4 points.
Program History
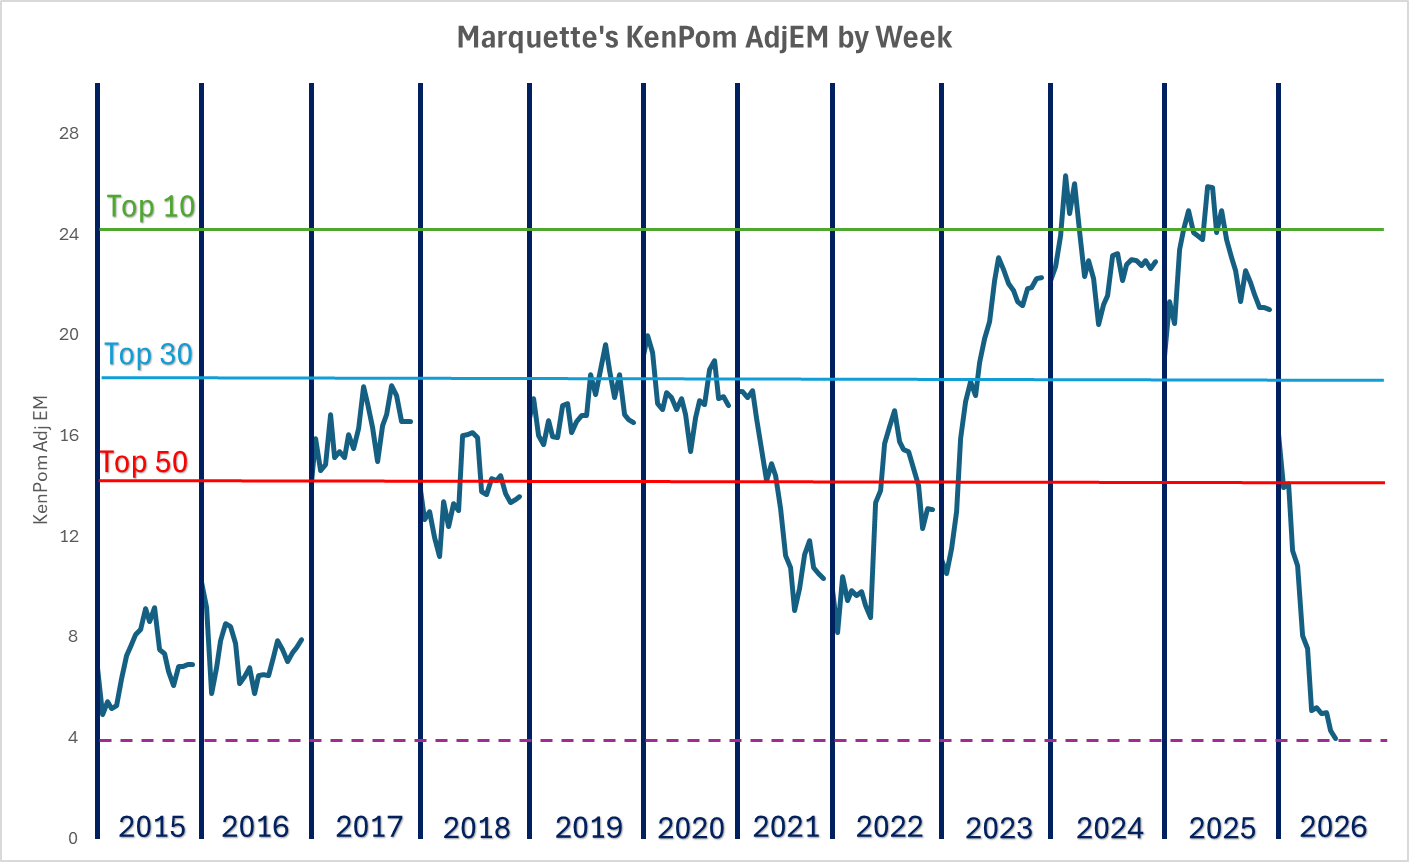
And going back a bit further than that…
(The horizontal “Top XX” lines are set not at any given year, but at what the averages for the 10th, 30th and 50th ranked teams are.)
As of 1/26/26, this is currently the lowest point in recent Marquette history. That low point was 4.91, and this team is sitting at 3.95.
Make a one-time donation
Choose an amount
Or enter a custom amount
Your contribution is appreciated.
Donate

Leave a comment