I don’t know about you, but one of my favorite pieces of post game content to read about are player grades. I know they are subjective, I know they are of dubious value, but reading about how other people thought a certain player performed is always interesting to me.
It’s just too difficult to get a good idea of actual performance of every player from a box score or even a game recap, let alone a 2 minute YouTube video, so I take what I can get.
However, Hoop-Explorer, one of the best college basketball stat sites around, came out with an even better concept. It took the RAPM formula (which grades out player impact based on some complex math taking into account on/off data, teammates, opponents and box score contributions) to spit out a single game impact number that is easily digestible. Even better, Hoop-Explorer puts it in an easy to understand chart that provides the context of who did well and in what facet of the game.
Take Marquette’s game against DePaul, it felt like an underwhelming result against a weak opponent with only a few standouts from Marquette. And using that player impact formula, you can see that’s exactly what took place.
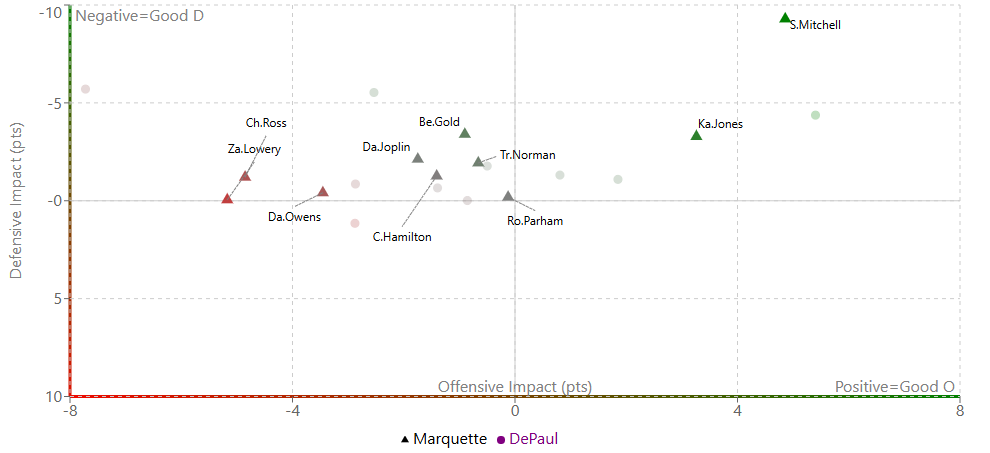
On the site you can hover over the triangles and see the exact outputs. So Stevie had the greatest impact on the game, adding 4.9 points on offense and 9.3 points on defense, for a total impact of 14.1. Every other non-Kam player was a negative on offense, but a positive on defense.
Again, this is a consistent mathematical way to get a “game score” for individual players on something that goes way past shooting percentage or even offensive rating. There are some games that have outliers, in the sense I didn’t expect the results to be that good/bad, but it’s always consistent to the formula, so even those outliers lead me to dive in to specific games again and see if there’s something I may have missed.
Scale
The grade itself is meant to convey credit, so the higher the better. Negative, like you probably inferred, means you provided less value than a generic replacement player. So to give a bit of context as to what numbers mean, here’s my interpretation of the scale
0-2: Role player/deep bench
2-4: Rotation caliber
4-6: Starter
6-8: Star
8-10: All Conference
10+: All American
That’s not to say these are hard cutoffs, just guides to how to interpret a number. And remember, there can be significant fluctuation from one game to the next. Take Stevie, his 14.1 against DePaul was his best outing of the season, but that was preceded by a -3.1 vs Creighton, which was his 3rd worst game of the year. There will be incredible game to game variance, this isn’t meant to tell the story of a full season.
Telling the story of a full season
But one thing you currently can’t do on Hoop-Explorer is see a full season’s worth of single-game grades at once. You can see full season RAPM, but I am interested in seeing patterns across time. So I built it myself.

This gives us a really nice big picture overview and puts into numbers easily what may have been evident with the eye test.
Take Kam Jones for example, the Big East season has felt like 70% of the version we saw in the noncon, and even though we can use stats like ORating and shooting percentages to validate some of that drop, it’s hard to put it into the context of what it means for the team.
Enter this dashboard.
On the 2nd tab, you can filter out these breakouts and see them in a few different charts, like the one below.
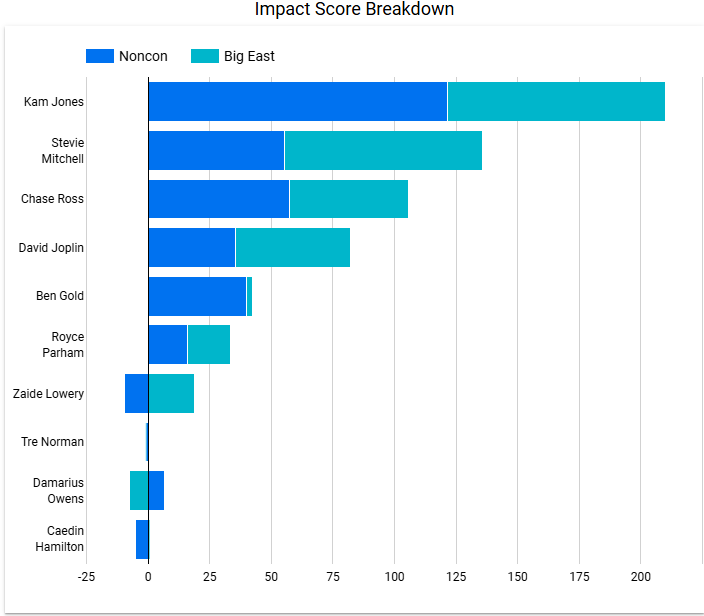
Here, we can visually see that Kam’s cumulative non-conference impact scores are higher than all but Stevie’s full season scores. That 121.5 was insane and why he was so deserving of the National Player of the Year Conversations he was on. Since Big East play began, he still leads Marquette with an impact score of 88.4, but that average of 6.3 per game is well below his noncon average of 11.1.
This isn’t to pick on Kam, of course, he’s still in line to be a 1st-team all Big East selection and I hold my breath any time he’s off the floor. Just trying to show how to use this dataset to test theories.
It also validates the seemingly recent rise of Zaide Lowery. He had a very difficult no-conference season, only posting 2 positive impact performances, and his minutes reflected that as MU moved into Big East play. However, his stretch since Seton Hall has been remarkable, and these scores reflect that.
At the end of the day these are still math formulas liable to errors, so no need to take every impact score as gospel. But as we move into the final stretch of the season, I wanted to provide a resource that might help you give both instant reaction* as well as appropriate context.
* One note, Hoop-Explorer doesn’t update until the middle of the night, and I have to manually pull that data into my own files before uploading them, so there will be a day or 2 lag on these results.
Make a one-time donation
Choose an amount
Or enter a custom amount
Your contribution is appreciated.
Donate

Leave a comment