As we inch closer to Fall and normal people start focusing on football, we college basketball sickos will instead start arguing about something that truly matters: non-conference scheduling.
With months still to go in this interminable offseason, getting to analyze and compare which teams padded on the cupcakes makes more sense than a lot of the other stuff we focus on. But one thing that is always challenging, to me, is finding a way to measure the difficulty of a schedule.
For starters, there have been no games played, so everything is a projection. There are a half dozen models that are pretty reliable and give us a full 360+ team look. Which one do we use? But more importantly, do we go by average, median, Q1 game, number of cupcakes. What’s the best measure of toughness? There is no real agreement here, and usually you see whatever best suits the team you follow.
But in case you missed it, there was a massive change in college basketball this summer, as the NCAA announced that Bart Torvik’s metrics would be added on to the selection committee’s teamsheets this March and a new metric, Wins Against Bubble (from here on known as WAB), would be included for the first time as well. I think we have a solution.
WAB Explainer
For those that have a life, WAB is a mathematical formula that aims to project what an average bubble team would do in a given game and, ultimately, how a team compares against others in a season given disparate schedules. Here is a GREAT 2 minute explainer from Jordan Sperber, formerly known as HoopVision on Twitter and now on Mississippi State’s staff. I highly recommend you watch this if you haven’t heard of WAB before.
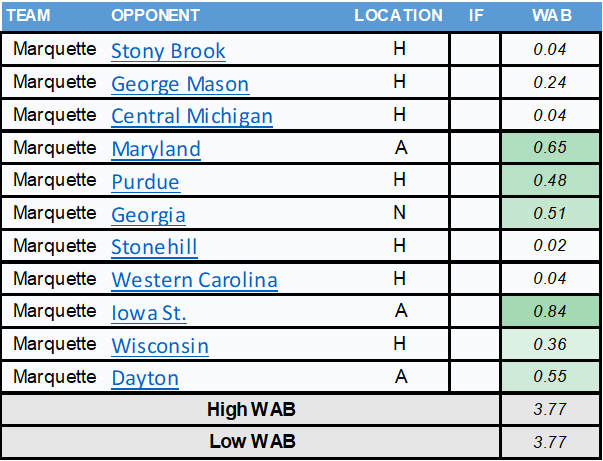
In case you didn’t watch, here’s the short version. For any given team, in any given game, the projection systems like TRank and KenPom will have a predicted win probability given an opponent and location. For example, Marquette will open the season at home against Stony Brook this November. Torvik, which ranks Stony Brook 275th in the country, gives MU a 97% chance of winning that game. But that doesn’t matter for WAB. What matters is how an “average bubble team” would do, and TRank gives an average bubble team a 96% chance of beating Stony Brook at home.
So if Marquette does end up winning that game, it will only earn .04 points, since it’s a given most tournament quality teams will win that game. However, if it does lose, it loses .96 points, as losses truly matter for WAB, not just wins. The penalty for losing to a cupcake is severe.
Contrast that with Marquette’s game against Iowa State in December. TRank’s model gives the average bubble team a 16% chance of beating the Cyclones on the road, so a win there is extremely valuable, worth .84 points (basically 21 Stony Brooks) and a loss only subtracts .16 from the season total.
When we put it all together, TRank projects Marquette’s highest possible WAB, should it win every game on the schedule, to be 3.77 points, or basically, almost 4 games ahead of how an average bubble team would perform against that schedule.

If you want the visual, I took the screenshot above for Torvik’s site. He has these for every team. It’s so worth your time.
Why is this better?
At this point some of you may be saying great, you can do simple math, why is this way any better than just looking at non-con SOS on TRank?
For starters, strength of schedule is an average, and averages can be easily fooled by extremes.
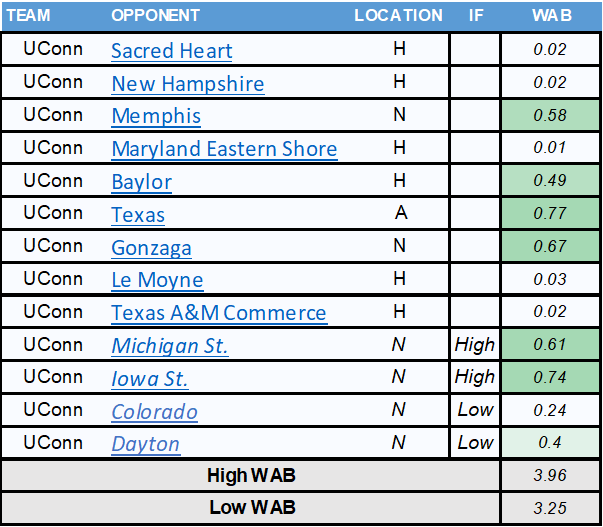
Let’s take UConn from last season as an example. Although they played some elite competition both home and away, they had a good chunk of cupcakes that obliterated their strength of schedule.
Northern Arizona: 318
Stonehill: 357
MVSt: 362
Manhattann: 336
Pine Bluff 329
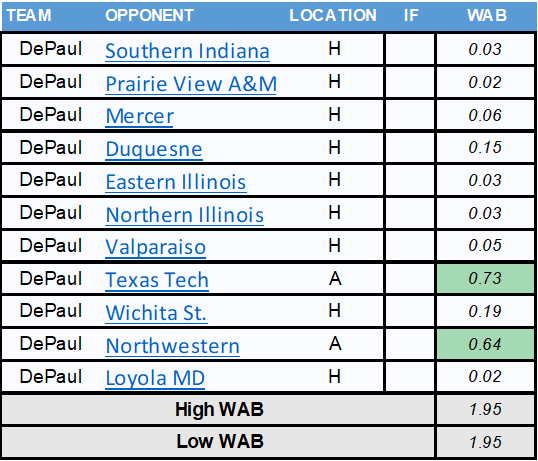
And as a result TRank had the Huskies with the 142nd best non-con SOS, 10th out of 11 teams in the Big East. Almost 100 spots behind DePaul. Yes, the math is correct, but it simply doesn’t fit the logic of what we are trying to accomplish. They played 4 top-15 teams, all away from Storrs. An average here does a disservice.
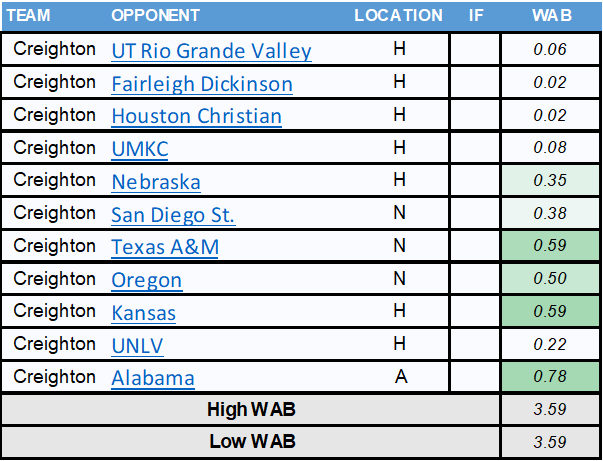
So I added up the game by game WAB for each Big East team to make it easier to visualize that difference. By WAB, UConn had the 5th toughest non-con schedule in the conference, only a smidge behind Villanova and Creighton.
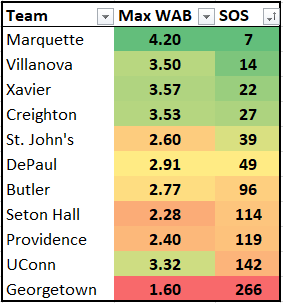
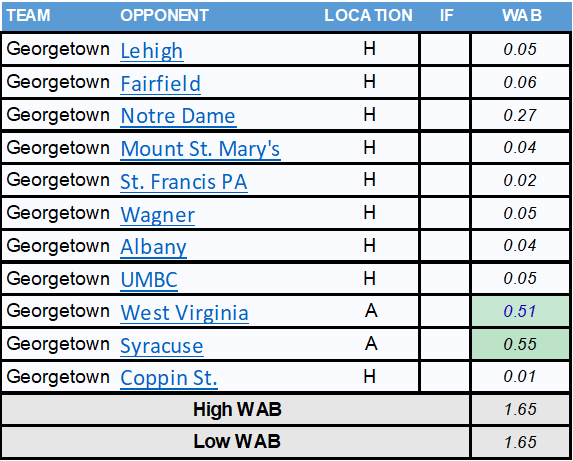
The Georgetowns of the worlds remain as basement dwelling empty calorie fiends, but UConn’s position makes much more sense now.
Coming back to 2025, another reason WAB is the best method for comparison is that it’s much simpler to map out potential matchup in bracket-style MTEs, and those matchups have enormous differences baked in.
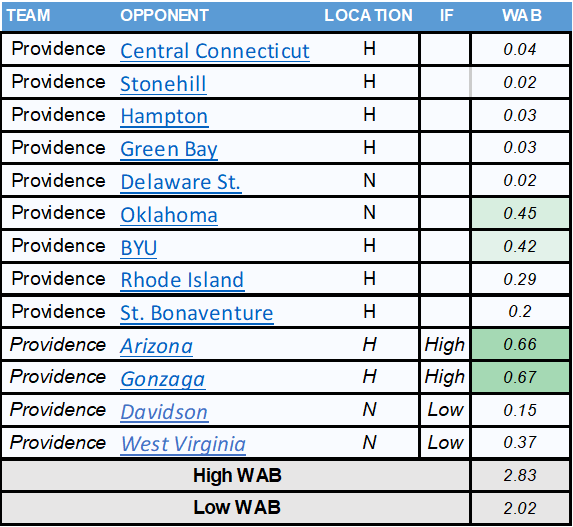
Take Providence for example. If you look at their listed opponents, it looks like a very underwhelming schedule. Only 1 top-30 team and only 1 projected Q1 game. Their SOS is the 3rd worst in the conference at 259, too. But even though their schedule has been released as complete, that doesn’t mean every opponent is listed. In fact, it will play 2 additional games that currently don’t show up in the metrics.
As a participant in the Bad Boy Mowers tournament in Atlantis, the rest of its schedule won’t be known until they actually play Oklahoma on Nov. 27. If they win, they will play the winner of Arizona vs Davidson. If they lose, they will play the loser. Using our WAB metric, we can game out these possibilities and put a hard number on the differences.
Let’s say the Friars beat the Sooners. They then have a 91% chance, per TRank, of facing Arizona, which is Torvik’s projected No. 10 team in the country. That alone is worth a potential .66 WAB points.
However, if the Friars lose to Oklahoma, it’s very likely they end up playing Davidson, ranked No. 166 in the projections, and that game carries a WAB score of 0.15, meaning a loss would be a huge hit to their resume.
Projecting out the final game isn’t as clear cut, as it will depend on multiple games worth of results. but in a best case scenario, Providence would play Gonzaga in the final (worth 0.67). In a worst case scenario, it would play West Virginia in the final game (worth 0.37). Here’s a visual to make it easier to follow.
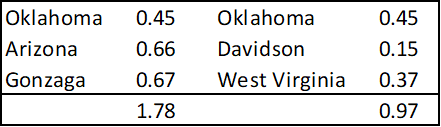
What this shows is how “hard” Providence’s schedule ends up being relies almost entirely on the result of its game with Oklahoma. The variance between a win and a loss is wider than for any Big East team I’ve tracked this offseason.
So who has the toughest schedule?
Now that we’re 1,500 words in, let’s answer the title of the post, which Big East team has the most difficult non-conference schedule? It depends.
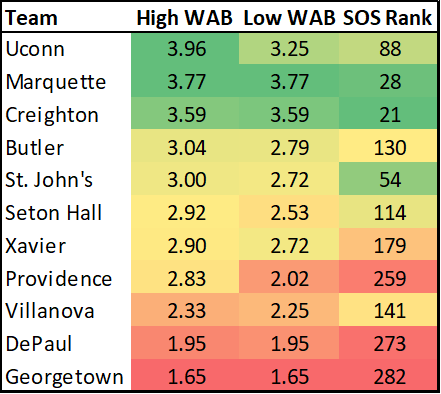
Using best possible opponents (labeled high WAB in the table below) for those in bracketed tournaments, that honor easily goes to UConn, whose WAB sum adds up to 3.96 in Torvik’s projections.
If you want to be uncharitable, and take a worst case scenario, that would then be Marquette, as those WAB points add up to 3.77, a smidge better than Creighton, and .52 better then UConn.
But, as I’m quick to point out when we start aggregating Big East rankings, I don’t think ranking best to worst makes a ton of sense. For all intents and purposes, we don’t need to be scientific down to the 2nd decimal on these kinds of projections. Opponents will under and overperform, with corresponding movements in WAB points, so the actual final numbers won’t even be settled until Selection Sunday.
Instead, I think putting in contextual tiers makes much more sense in getting an overall picture of nonconference strength.
If we are using High WAB, it would look something like this:
Elite: UConn, Marquette, Creighton
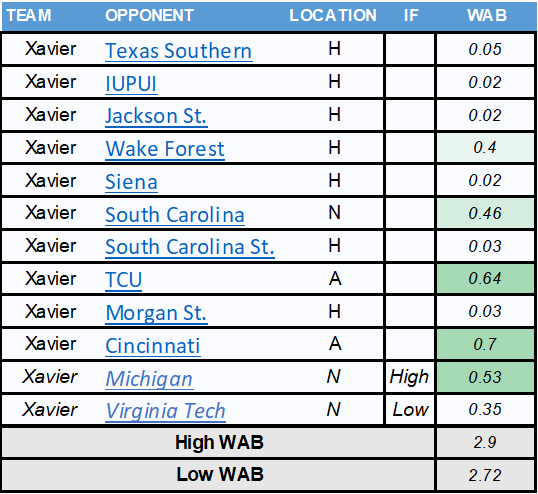
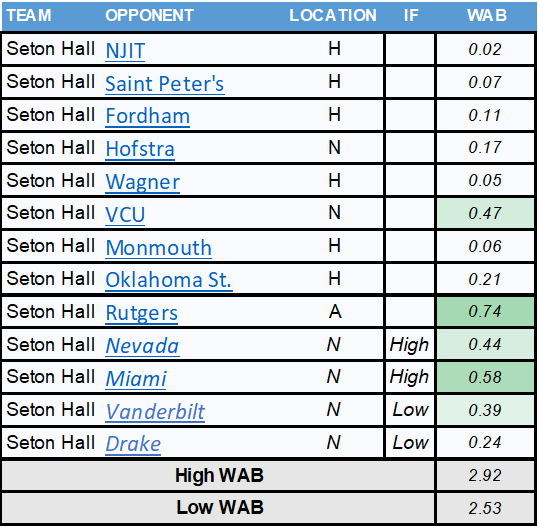
Good: Butler, St. John’s, Seton Hall, Providence, Xavier
Poor: Villanova, DePaul
WTF: Georgetown
If we use Low WAB:
Elite: Marquette, Creighton
Good: UConn
Fine: Butler, Xavier, St. John’s, Seton Hall
Poor: Providence, Villanova, DePaul
WTF: Georgetown
Not a ton changes, but gives you an idea of the ranges of expectation.
Of course, as we mentioned earlier, these numbers are what the WAB scores would be if a team goes undefeated in the noncon. That’s not going to happen for most teams. So simply having a super difficult schedule based on WAB isn’t necessarily helpful come March.
If you are interested, here’s what that looks from last season like once you add in the results in the “Actual WAB” column.
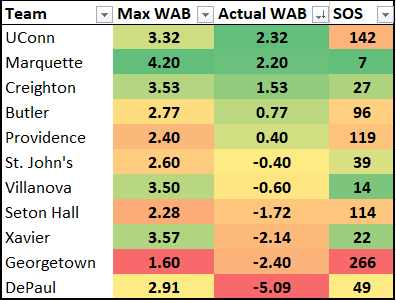
A team like Xavier had a fantastic, extremely challenging non-con schedule, based on WAB, the 2nd toughest in the conference. However, as they not only dropped most of the top games, but also lost to Delaware (-0.91) and Oakland (-0.87), X ended up with the 3rd worst non-conference performance.
Again, all of this is to say, a difficult non-con isn’t in and of itself a good thing. And this is where WAB once again is very useful in showing how results are ultimately what matters.
So even though we can and will argue about cupcake schedules, this is a great exercise in showing that scheduling to your team’s abilities makes much more sense than going for a half-court shot in November and December.
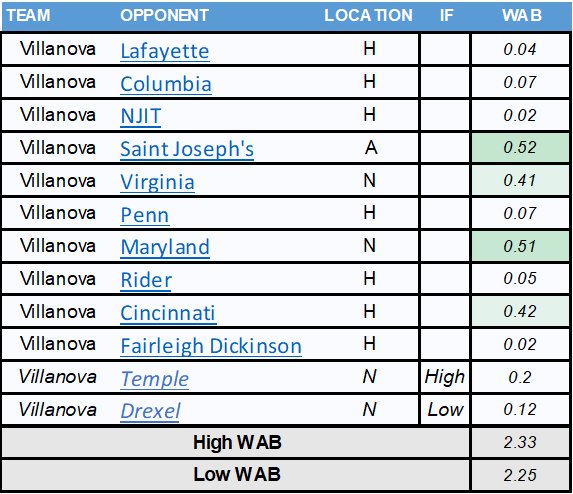
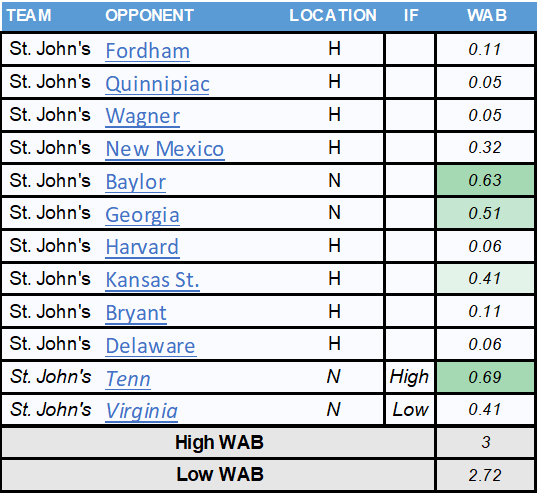
WAB Schedules
And in case you haven’t clicked over to Bart Torvik but are interested in seeing the game by game WAB breakouts, click on the images below.

Make a one-time donation
Choose an amount
Or enter a custom amount
Your contribution is appreciated.
Donate

Leave a comment