I’m a sucker for data, so when I saw an article in The Athletic this morning about the NCAA launching a new dashboard of anonymized NIL data I had to dive straight in.
NIL is one of the biggest drivers of news (and players) around the country, but despite its prominence, everything about it is still murky. One site may report player X is getting $2 million in NIL only to find out at the end of the season the real number was nowhere close.
And while this attempt has plenty of caveats, primarily that these are only on deals that were reported, there is new NCAA legislation that requires more disclosure. From he article above: “In January, the Division I Council adopted new rules requiring athletes to disclose to their schools any NIL agreement exceeding $600, including terms of the deal, services rendered and payment. The schools then must share the information, stripped of names, to the NCAA at least twice per year.”
For those that want to poke around, here is the dashboard: https://nilassist.ncaa.org/data-dashboard/.
And here are a few takeaways from my dive in.
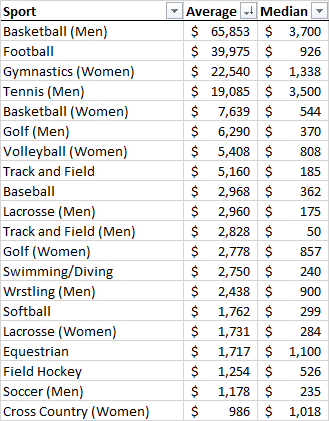
Men’s Basketball Is The Most Valuable
When breaking out the average NIL earnings by sport, the big thing that stands out is that men’s basketball players are the most well-compensated athletes, on average, in the NCAA, with $65,853 in average earnings per player through July 2024.

I was a tad surprised to see men’s basketball ahead of football, but then again, this is an average per player, so football’s enormous rosters mean the average gets quite diluted.
Still, when football’s value to the ballooning TV media contracts are worth 80% of the total deals, it is interesting to see basketball players individually bring in 64% more than football players. Again, I do realize feeding 80+mouths per team is much different than doing so for 10-13 players, so that is definitely taken into account, but from a player’s perspective, playing basketball is just much more lucrative for NIL than playing football.
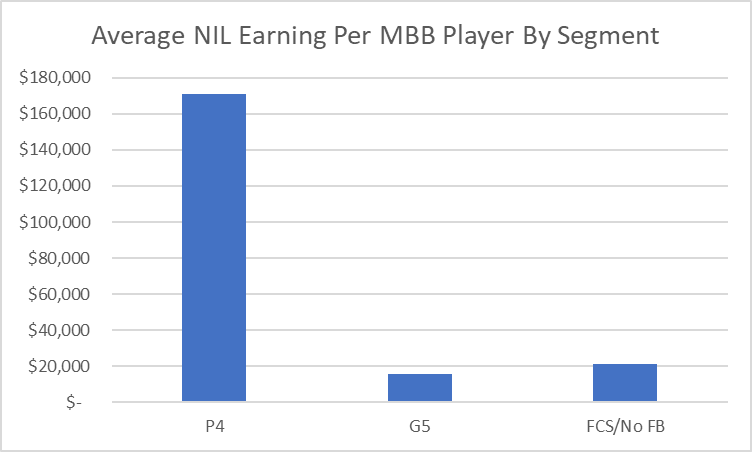
Segmenting the P4
The really nice thing about this dataset is it gives us the option to slice the data between 3 segments: P4, G5 and FCS/Non-Football. And in doing so, we can see that the P4 is basically a different league entirely.
The average P4 athlete (across all sports) makes $43K in NIL earnings, which is 1032% more than what G5 athletes make, and 1129% more than what FCS/Non-Football athletes make.
Taking that data simply for men’s basketball, we can see that the disparity remains vast. The average P4 men’s basketball player makes $171,272 through NIL compared to $15.8K and $21.2K for the other 2 segments.
Of course this is where a blog based on following Marquette and the Big East will note that the reason the non-football/FCS segment is larger that G5 is because that’s where the Big East schools get placed, and thus drive up the average. Schools like Villanova have been reported to spend over $2 million in NIL a year. Considering there are over 200 schools in this chunk, mostly low and mid major, it won’t give us a very good look at what Big East schools actually spend.
For now, I would assume that P4 prices are pretty much in line for Big East schools, and will wait for the NCAA to add conference segmentation, as they intend to once they have a large enough anonymized sample.
What about QBs?
I still couldn’t shake the fact P4 football players made so little, compared to basketball players, so wanted to drill down further. Surely P4 QBs would be the most lucratively paid players, right?
Nope.
Filtering the database by position, here are the average P4 NIL earnings by position.

So even the highest paid position makes less than the average men’s basketball player (on average).
Conclusion
One other super important caveat is that the data here is for 2024 YTD, which means none of the actual CFB regular season was included. I’ll wait and see what these numbers look like in a few months and follow up.
For now, while there are still holes and caveats, we get a much better sense of the true NIL landscape and how valuable high-level basketball players actually are.
Here’s a look at the average earnings of the top 20 sports, as of 8/1/2024.
Make a one-time donation
Choose an amount
Or enter a custom amount
Your contribution is appreciated.
Donate

Trackbacks/Pingbacks
[…] https://painttouches.com/2024/08/01/ncaa-nil-data-shows-mens-basketball-players-highest-earners/?utm… […]
[…] can find more on these numbers through Bloomberg News and deeper NIL research on men’s basketball NIL earnings and college athlete […]
[…] is said to have pulled down over $4 million this past season. We do know aggregate information; the average NIL amount from 8/1/2024 to 4/20/2025 was $53,643, but the median was just $3,371. This means that the top players were getting the […]
[…] Flagg abbia abbattuto oltre $ 4 milioni nella scorsa stagione. Conosciamo informazioni aggregate; L'importo medio zero dall'8/1/2024 al 20/04/2025 era $ 53.643, ma la mediana era di soli $ 3,371. Ciò significa che i migliori giocatori stavano […]
[…] Chart courtesy of Andrei Greska via Paint Touches […]