Somehow we are in mid February already, and with Marquette two games behind UConn, this is a week that will go a long way to shaking our whether a regular season repeat is still feasible.
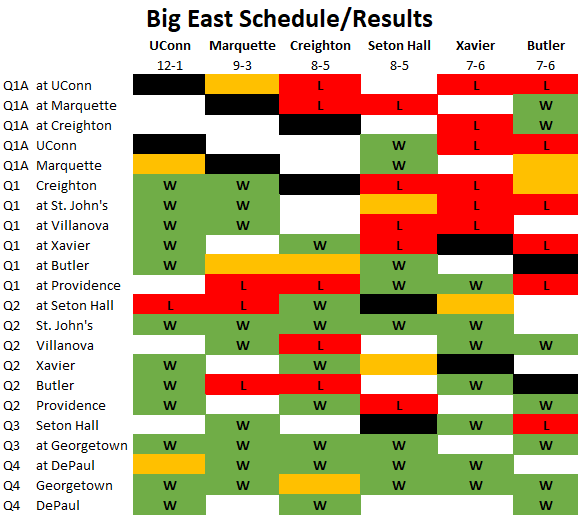
I’ve posted a Big East schedule and result map below, to help guide what games each teams have left, sorted by their NET quadrant positioning. After this week, both UConn and Marquette will only have 3 Q1 games left.
Massey Composite Ranks

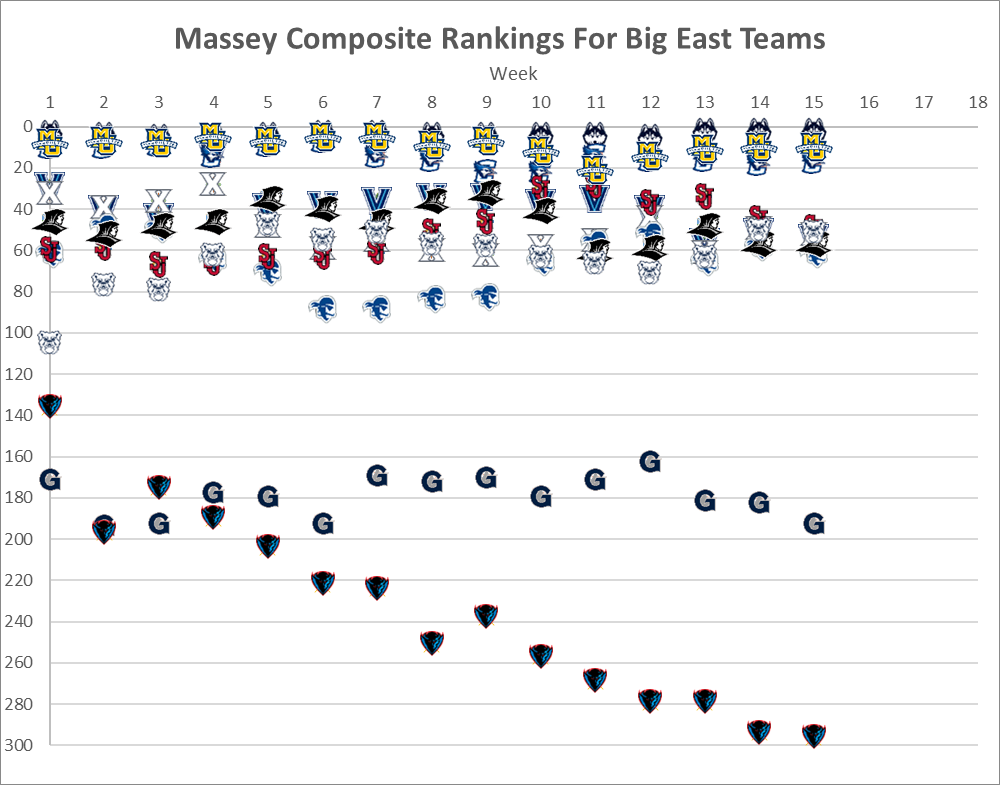
I’m a huge proponent of using preseason ranks as a gauge to measure season results. And the fairest way I’ve found is using Massey’s Composite ranks, which collect 20+ human and algorithmic models to give you an overall look at how teams measure up.
Collecting these weekly also gives us a great visual to see the rise and fall. Like take Villanova. There were projected to be the 4th best team in the league, in a 2nd tier behind the top 3. And although they are in a 2nd tier behind the top-30, they have fallen over 40 spots from where they were in the 4th week of ratings.
You may also be asking, why are there only 9 teams? Because adding in Georgetown and DePaul makes it a useless chart.
TRank Efficiency Tiers
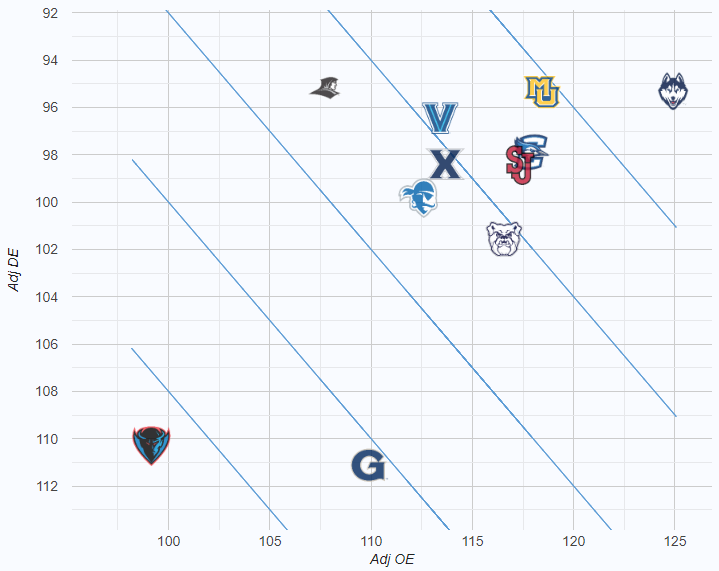
I still love my OG TRank charts. This one measures the adjusted offensive and defensive efficiency (taking pace out of the equation) and adds in the lines based on national trends. Even though Marquette is clearly the 2nd best team in the league, you can visually see the gap between them and UConn is larger than that of any team behind them, to date.
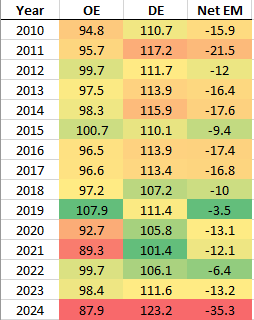
KenPom Conference Efficiency Margin
Similar to TRank, this KenPom efficiency margin chart removes pace, but doesn’t adjust for opponents, since it is just measuring Big East play. Again, the gap between 1 and 2 is wider than the gap between 2 and 3.
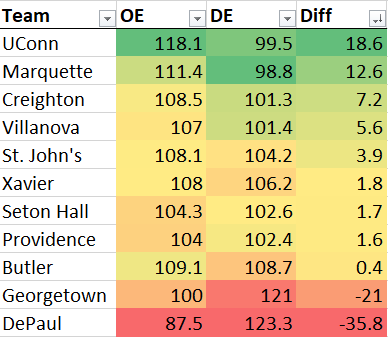
I’d also like to call out the bottom here as DePaul’s inefficiency as it’s something kind of historic. Last season, Georgetown finished Big East play at -17.1, worst in the league but almost 2 full points. DePaul is currently 18 points worse. In fact, it’s the worst DePaul team since at least 2010, by a significant margin.
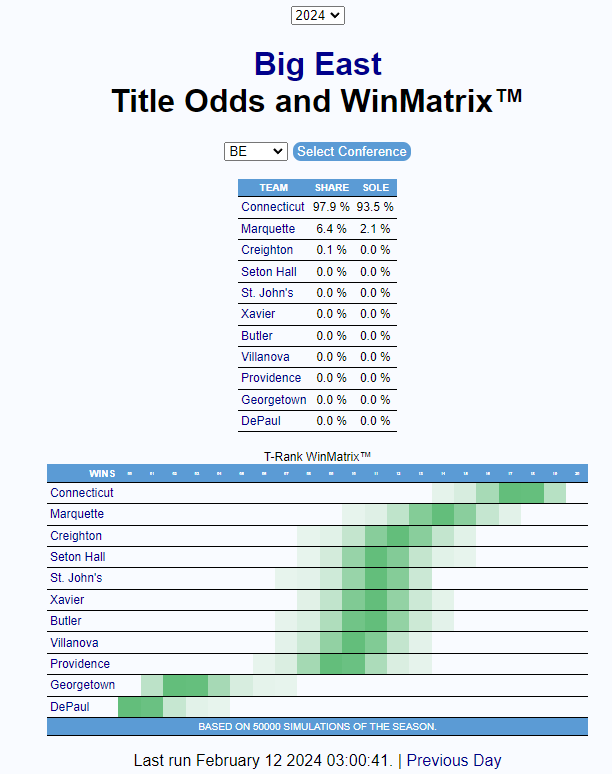
Big East Title Odds
It’s UConn’s to lose at this point.
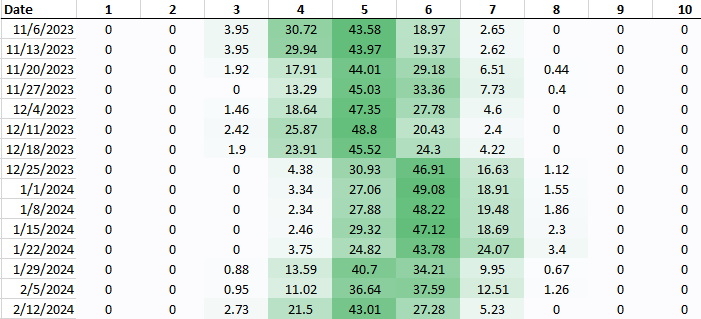
Big East Tournament Odds
I like to track Bart Torvik’s projections for how many Big East teams will go dancing. As of this morning, it’s between 4 and 6, down from between 5 and 7 last week.
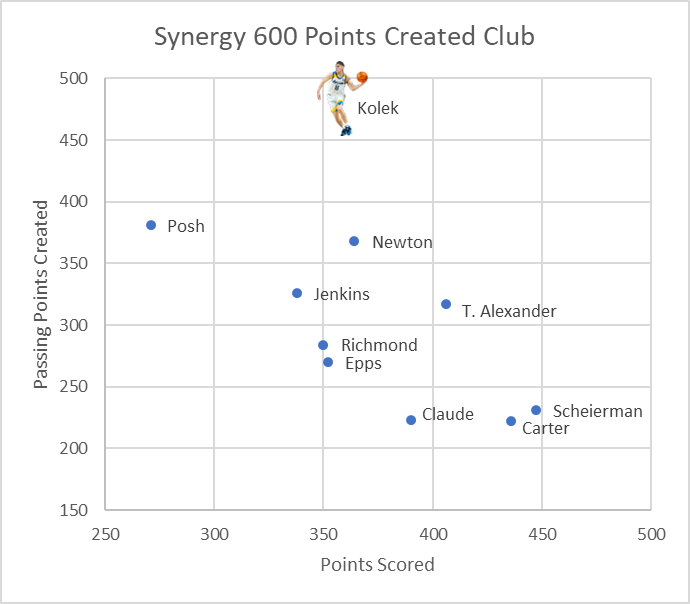
Points Created
Synergy has an incredible metric where they not only add up points scored, but assign value to both assists as well as passes that lead to free throws. It rally gives you a full picture on who the best creators are in the country.
Focusing on the Big East, Tyler Kolek stand alone.


Leave a comment