As we prepare for the upcoming 2024 season, and preview szn starts up in earnest, you will see and read a lot of complimentary words about Marquette, particularly as it relates to them being a pretty known commodity.

They were very, very good last year. They return everyone but OMax. They should be very, very good again this year.
Look, I am not one to disagree, I too think Marquette should be considered a Big East favorite and have its best chance of reaching the Final Four in two decades, but the doldrums of summer and the lack of news have me thinking and overthinking.
Is it in fact a good thing to “run it back” with 4/5ths of the same squad? Or does that just raise the floor without actually touching the ceiling? A strange set of clicks on Twitter got me to a pretty analytical user that harped on this exact thing in April (before OMax got drafted).

Well that’s just like your opinion, man.
But if you’ve ever read anything on PT before, you know I can’t just leave these hypotheticals hanging. I need to at least take a swing.
KenPom Continuity
To start with, I visited the GOAT KenPom’s data and compared his 2023 and 2022 datasets for Continuity and Adjusted Efficiency Margin. (For those who haven’t seen it before, Ken measures continuity as “determining what percentage of a team’s minutes are played by the same player from last season to this season.”)
In that linked post, KenPom shows that from 2008 to 2016, there was a positive correlation between continuity and performance, with an R of 0.34 for Off Efficiency and 0.24 for Def Efficiency.

For those unfamiliar, the closer to 1, the more direct the correlation. Based off that data, KenPom himself writes: “teams with more continuity tend to perform better, with the effect being stronger on offense.”
In the 2022 and 2023 combined data, using Adjusted Efficiency Margin rather than splitting out the O and D numbers, there seems to be a bit of a lower correlation than in the past, with R equaling 0.21. However, I was interested in seeing how it manifested among power conference teams, and there R was a smidge higher at 0.24.
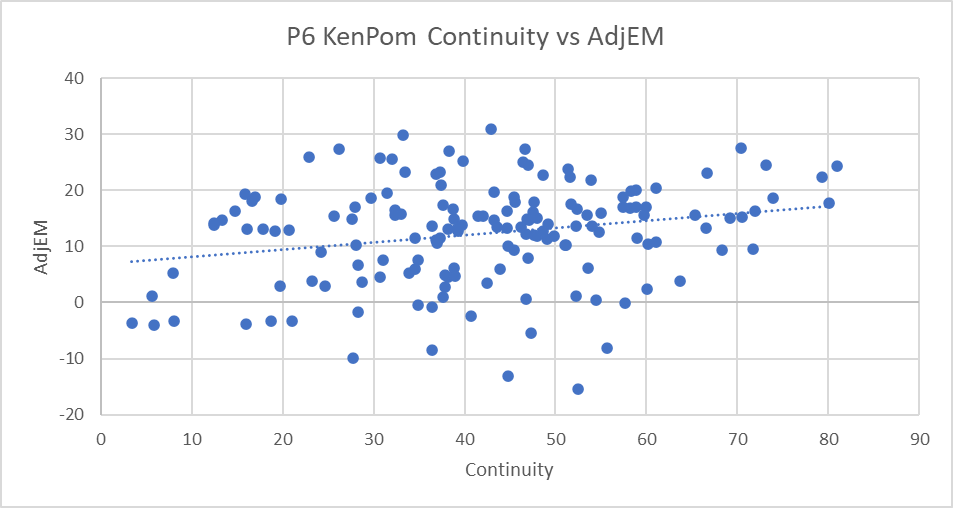
What this is basically showing is that P6 teams that have a very high rate of continuity of late (over 70%) tend to fall anywhere between good and very good, with only 1 of the 9 teams that met that criteria falling below +15 for AdjEff margin. For reference, +15 would have ranked 40th in Kem Pom in 2022, and 44th in 2023. So the floor for these kinds of teams tends to be the NCAA Tournament.
However, the data also shows simply returning everyone doesn’t automatically mean huge success. Of the 9 teams in this sample, only 4 had an Adj EM over 20 (top-15ish in a given season). So a relatively small sample of KenPom gets us to: it’s definitely good to run it back, but that alone isn’t going to make a team a title contender.
Still, I was curious about what it meant for Marquette in particular, to see if MU teams with a lot of continuity had a higher level of performance. When we open up the data as far back as it goes (2008 in this case) and simply focus on Marquette, R equals .587, over twice as correlated as we’ve seen from KP’s all-teams data or the P6 past two seasons, and a resounding yes to that question.

One other interesting note is that Shaka in particular has performed significantly better than you would expect based off the level of minutes continuity from the previous season in his 2 years at Marquette.
Torvik Returning Minutes
Of course, the biggest issue with KenPom’s data, is that continuity is based off of actual games played. So even though we are confident that Marquette will have a lot of it based off of returning minutes, we probably can’t use it for preseason analysis quite yet.
Enter TRank.
Bart Torvik’s Godsend of a site gives exactly what we crave, using prior year’s stats to provide an estimated returning minutes metric before each season. And he went above and beyond when I reached out to him, sending me a file with returning minute numbers through 2009.
I went ahead and filtered out non P6 teams, to once again keep the competition levels faced relatively similar, and came up with 73 separate teams with at least 80% of minutes returning since 09, about 5 per season.
Wanting to keep the dataset “recent” to modern times, I dug around for examples from just the past 5 seasons, and came up with these 23 teams that each returned 80%+ minutes from the previous season.
| Year | Team | Ret Min | Barthag | Rank | NCAAs | Seed |
|---|---|---|---|---|---|---|
| 2023 | TCU | 89.42 | 0.8704 | 28 | YES | 6 |
| 2023 | Virginia | 87.8 | 0.8591 | 34 | YES | 4 |
| 2022 | UCLA | 90.48 | 0.9321 | 10 | YES | 4 |
| 2022 | Purdue | 90.94 | 0.9267 | 12 | YES | 3 |
| 2022 | Butler | 96.14 | 0.6318 | 117 | NO | NO |
| 2021 | Texas | 96.88 | 0.9006 | 19 | YES | 3 |
| 2021 | Rutgers | 81.51 | 0.8444 | 42 | YES | 10 |
| 2021 | UCLA | 86.59 | 0.9022 | 18 | YES | 11 |
| 2021 | Missouri | 87.09 | 0.8509 | 41 | YES | 9 |
| 2021 | Utah | 85.69 | 0.8381 | 49 | NO | NO |
| 2020 | Maryland | 83.29 | 0.88 | 26 | YES | 3 |
| 2020 | Illinois | 81.65 | 0.8723 | 29 | YES | 7 |
| 2020 | Penn St. | 83.17 | 0.902 | 15 | YES | 6 |
| 2020 | Notre Dame | 88.39 | 0.8007 | 55 | NO | NO |
| 2020 | Seton Hall | 85.71 | 0.8915 | 21 | YES | 3 |
| 2020 | West Virginia | 88.05 | 0.9014 | 16 | YES | 6 |
| 2020 | Colorado | 94.12 | 0.8379 | 42 | YES | 8 |
| 2019 | Tennessee | 87.08 | 0.9447 | 10 | YES | 2 |
| 2019 | Syracuse | 90.72 | 0.8551 | 36 | YES | 8 |
| 2019 | Mississippi St. | 83.58 | 0.8916 | 23 | YES | 5 |
| 2019 | Wisconsin | 90.08 | 0.902 | 19 | YES | 5 |
| 2019 | Iowa | 82.54 | 0.829 | 44 | YES | 10 |
| 2019 | Washington | 95.18 | 0.804 | 51 | YES | 9 |
Upon a quick glance, there isn’t anything to get super excited about. There were only two teams that finished the season in the top-10 (UCLA in 2022 and Tennessee in 2019) and both finished exactly at 10, getting bounced in the Sweet 16 of the NCAA Tournament.
But what I was trying to answer wasn’t necessarily do teams with a lot of returning minutes do well in the Tourney, but rather, can teams that return 80%+ of minutes make a leap from the previous year?
Taken as a whole, returning that many minutes is an incredibly powerful reason for projecting significant improvement. Using that 23-team sample, I also pulled in where those teams finished the last season, in order to give a proper comparison baseline. On average, teams returning 80%+ of minutes since 2019 see an increase of .0819 on their Barthag, which is the equivalent of a 30 spot jump in the rankings, from an average ranking of 62 in the prior year up to 33 the season in question.
And this isn’t a case of a few outliers skewing the average, either. Only 2 teams in the sample experienced a drop in their Barthag (Rutgers 2021 and Maryland 2020) with a median increase of .0844 (worth about 27 spots in the rankings). It is unambiguous to say that heavily experienced teams like these usually see significant year over year improvement.
Elite Teams Running it Back
Of course, it would be literally impossible for Marquette to jump up 27 spots in the rankings, seeing as it finished 12th in Bart’s last season. It also couldn’t meet the average jump in Barthag without going over the mathematical limit. So in the case of Marquette, and to try and answer the original question at the top of the page, I wanted to limit my scope only to teams that finished in the top-20 of the previous season’s rankings. These are teams that are proven to be successful at a nearly elite level, and don’t necessarily need the returning players to make any leaps.
The issue is that these teams are incredibly rare. In the 5 year sample we grabbed, only 2 fit the description: UCLA in 2022 and Tennessee in 2019. So we dug a tad further into the archives and tried to match teams back until 2015, which gave us an additional 2 data points in Kansas 2016 and Wisconsin 2015.

Tiny sample alert, but from these examples, every team that was previously in the top-20 finished in the top-10 the next season. And even a team like Tennessee, that moved up 2 spots from 12 to 10, saw a pretty significant increase in its Barthag.
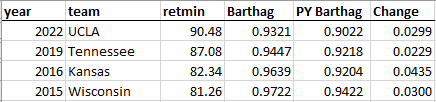
If we add the Volunteer’s 0.0229 Barthag increase, the lowest of the bunch, Marquette would jump up to 5th in last year’s rankings, a pretty significant boost, but not necessarily enough to be the top team. Still, when your “worst case” scenario is Marquette only sees a small improvement and finishes as a top-10 team with a protected seed, there are worse places to be.
Conclusion
I have 3 takeaways after spending way more time than I wanted on this.
- Returning a ton (or 80%+) of minutes is undoubtedly a “good thing” no matter how or where you want to measure.
- Even at the top-20, teams that brought back that level of minutes see improvement and have an extremely high floor.
- Elite teams are almost never in this position, so there isn’t a ton of data to compare against.
Marquette fans are in an enviable position. Sure, there is nothing that guarantees March success, but these are the kinds of seasons coaches dream about. Enjoy it for all it’s worth.


Great post – especially interesting these past couple years as the portal has gone crazy. Are you able to forward the continuity data that Bart sent? I’m interested in understanding the correlation between continuity and YoY team improvement, but am having a hard time getting the data.
Sure thing, here’s the link: https://www.dropbox.com/s/0xuphafwgm8g3wp/retmins.csv?e=1&dl=0
Thank you!